Jill R D MacKay1,4, Jessie Paterson1, Vicky Sandilands2, Natalie K Waran3, Bryony Lancaster1, Kirsty Hughes1
1 University of Edinburgh, UK
2 Scotland’s Rural College (SRUC), Edinburgh, UK
3 Eastern Institute of Technology, New Zealand
Massive Open Online Courses (MOOCs) are currently a popular buzzword in higher education, still receiving interest from educational institutes and within educational research, even after an initial ‘boom-bust’ cycle (Hammershøj, 2018). In principle, MOOCs ought to be Massive, with user sign ups ranging from 2200 on the first known MOOC (Mackness, Fai, Mak, & Williams, 2010) to 180,000 sign ups (UUK, 2012) with 20,000-70,000 sign ups being the norm (Jordan, 2014). Despite these impressive numbers, actual class sizes are often much smaller, with only small percentages of those who sign up actively taking part within the course (UUK, 2012). MOOCs ought to be Open, referring both to their ability to offer access to wide audiences and for their educational resources to be re-used. This has led to concern in higher education as to whether MOOCs will be disruptive to the higher education model (Lawton & Katsomitros, 2012; UUK, 2012; Vardi, 2012). Despite the claim to openness, many commercial platforms for MOOCs, such as Coursera, now charge for the certificate of course completion (although not the materials themselves), which was predicted by the UUK report highlighting the lack of a transparent and sustainable MOOC business model in 2012. Finally, MOOCs should be Online Courses, a unit of teaching delivered online that delivers discrete learning outcomes. When MOOCs have been incorporated into traditional higher education, poor retention rate has been attributed to a lack of digital skills in the students, such as in a paediatric nursing MOOC (Goldschmidt & Greene-Ryan, 2014). Coupled with recent concerns about incorporating blended learning effectively in classrooms (Bothwell, 2016; Holley & Oliver, 2010), the pedagogical principles behind MOOCs should be scrutinised.
The research surrounding MOOCs tends towards the speculative questioning of the future of higher education in a digital ‘free information’ ecosystem (Baggaley, 2013; Conole, 2013; Fox, 2013; Martin, 2012) or case studies of one or two MOOCs exploring a variety of measures of success (Belanger & Thornton, 2013; Breslow et al., 2013; MacKay, Langford, & Waran, 2014; MacKay, Langford, & Waran, 2016; Mackness et al., 2010; Paterson et al., 2016). Comparative MOOC studies are relatively rare and have focused on pedagogy and digital cultures (Watson, Kim, & Watson, 2016), attempting to establish which course is ‘most effective’ at a common goal or aim. Not all MOOCs will have the same goal and yet meaningful comparisons can be drawn between such courses in order to benchmark MOOC learner behaviour and the utilisation of MOOCs in science education. This paper aims to do so within the field of veterinary science.
The authors opine that there are many outstanding questions about the uses of MOOCs in Higher Education. The MOOC landscape is constantly changing which presents a significant challenge for their evaluation, particularly with long lead in times to journal publication. This has resulted in many MOOC publications emerging from specialist interest publications, grey literature or non-peer reviewed specialist articles. It is also challenging to study MOOCs across cohorts and teams, with concern about a Higher Education Institute’s (HEI) strategy being exposed. Finally, commonly reported metrics such as retention rate (proportion of learners signed up to a course that achieved a final certificate) are not particularly informative. The industry standard for retention rate is commonly reported as 10% (Rivard, 2013), however reported rates are often much lower (10% for “Internet History, Technology and Security” (UUK, 2012) 7% for ‘‘Software Engineering,’’(Meyer, 2012) 5% for ‘‘Circuits and Electronics,’’(Daniel, 2012) 3% for ‘‘Bio- electricity’’(Rivard, 2013)). Retention rate does not capture a learner’s intent or their experience within a MOOC and has therefore been criticised as a measure (Kizilcec, Piech, & Schneider, 2013; MacKay et al., 2016) so it is sometimes calculated as the proportion of learners still active at the end of a course, as seen in the UUK report based on the open data from the University of Edinburgh (University of Edinburgh, n.d.). Artificial Intelligence Planning retained 2.5% of their sign ups as active users, while Astrobiology (both University of Edinburgh) retained 20.1% of their sign ups as active users. Retention rate as active users remaining is still a fairly blunt metric of course success. Broad overviews of a number of courses do exist, providing standardised measures allowing for cross course comparisons (Bayne & Ross, 2014; University Edinburgh, 2013; UUK, 2012) but by taking a very broad overview it can be difficult to judge the more detailed subject-specific aims and outcomes. Within the peer reviewed literature, there is therefore a lack of longitudinal comparative studies on courses with broadly similar subject areas.
Universities UK recommended in their report (UUK, 2012) that Higher Education Institutes consider three main aims when embarking on a MOOC: mission (what role does a MOOC serve in knowledge exchange and research impact?), recruitment (what role does a MOOC serve in diversifying student recruitment, with an emphasis on accessible education?) and innovation (what role does a MOOC play in improving the delivery of education?). They also identified four challenges for HEIs intending to deliver MOOCs: sustainability (upfront costs and ongoing running costs); pedagogy (adding value to educational experiences); credit (how should MOOCs be recognised as learning); and capacity (how often should institutes innovate new delivery models vs the development of online courses). We will use this framework to investigate the longitudinal performance of a number of MOOCs provided within the veterinary sciences by the University of Edinburgh and associated institute Scotland’s Rural College to explore the following research questions: how do the popular metrics of class size, retention and drop-off rate compare across a range of veterinary science MOOCs; and how effective can these MOOCs be considered in terms of producing sustainable educational resources, and widening participation in veterinary sciences?
Ethical approval for the study was granted on the 22nd August 2016 by the Human Ethics Review Committee at the R(D)SVS, Project: ‘Cross MOOC Comparison-10/08/16’
The courses included in this study include courses which have run as session based courses with discrete timetables and on-demand (OD) courses which are always open. Session based courses are numbered 001-003 to reflect what order the sessions ran in. Each session ran successively, with its own recruitment period (although it is known that some students would repeat sessions, we do not know how many would do this, or their motivations for doing so). As of July 2016, Coursera have begun moving the on-demand courses onto a new ‘rolling session’ type. While the content remains the same, rolling sessions enroll students into four week cohorts with suggested deadlines for content completion. Each cohort sees a cohort-specific discussion board. The course names, duration and content are described in Table 1.
Working within the Coursera platform has led to a number of inconsistencies within course delivery and the data available for research purposes, hence sample date data is important for contextualising the Coursera ecosystem. The major changes affecting these courses is detailed in Table 2. Predominantly these changes affect comparison of retention across courses as the number of Statement of Accomplishments that were awarded were considered the number of course finishers. With the exception of Equine 001, which started prior to the Signature Track introduction, all session courses have comparable environments for ‘Statement of Accomplishments’. The on-demand courses all rely on a paid ‘Verified Certificate’ to recognise learning; as of December 2016 (time of sampling) this was £39.00.
Table 1: MOOC content, session based and on-demand (OD), offered by the Royal (Dick) School of Veterinary Studies on the Coursera platform as of October 2016
|
Course Name and Session Start Date
|
Format |
Total N Items (Videos, interactive learning activities and additional resources) |
Total Core Lectures |
N Quizzes and Pass Mark |
|
|
Animal Behaviour and Welfare |
|||||
|
|
Animal 001 (14/07/2014)
|
5 Weeks |
51
|
21 |
5 (80%)
|
|
Animal 002 (09/02/2015) |
Session 002, and OD included a sixth optional week ‘Animals in Research’ |
53 |
26 |
||
|
Animal OD (01/11/2015) |
53 |
26 |
|||
|
|
|
|
|
|
|
|
Chicken Behaviour and Welfare |
|
|
|||
|
|
Chickens 001 (03/04/2015) |
5 Weeks
|
66 |
53 |
5 (60%) Plus 1 non-graded exercise |
|
Chickens OD (02/05/2016) |
66 |
53 |
|||
|
|
|
|
|
|
|
|
EdiVet: Do You Have What it Takes To Be a Veterinarian? |
|
||||
|
|
EdiVet 001 (19/05/2014) |
5 Weeks
|
55 |
46 |
5 (60%) Plus 2 non-graded revision exercises |
|
EdiVet 002 (12/01/2015) |
54 |
46 |
|||
|
EdiVet OD (01/08/2015) |
54 |
46 |
|||
|
|
|
|
|
|
|
|
Equine Nutrition |
|
|
|
||
|
|
Equine 001 (16/01/2013) |
5 Weeks
|
21 |
13 |
5 (60%) |
|
Equine 002 (27/01/2014) |
38 |
32 |
|||
|
Equine 003 (26/01/2015) |
39 |
32 |
|||
Table 2: Major changes to Coursera platform throughout study period
|
Date |
Change |
Description of Impact |
|
09/01/2013 |
Signature Track introduced |
Signature Track introduced a ‘verified certificate’ which used a combination of keystroke recognition and webcams to verify the identity of the learner at assessment. This was considered a more robust form of proving continued professional development and advertised as such on Animals, Chickens and EdiVet (‘Coursera Blog • Introducing Signature Track’, 2013) |
|
May 2015 onwards |
Statement of Accomplishment removed |
The free ‘Statement of Accomplishment’ certificate, often used as a ‘finisher’ metric, was phased out from November 2014 and removed from Coursera by mid 2015 (K. Unknown, 2015; ‘Verified Certificates Ensure Academic Integrity’, 2014) |
|
Early 2015 |
On-Demand courses introduced |
Courses moved into the On-Demand format, where they run continuously. No new session based courses being offered. |
|
Late 2015 |
On-Demand courses moved to ‘Session Based’ |
On-Demand courses moved to ‘Session’ courses, referred to in this study as ‘Rolling Sessions’ (A. Unknown, 2015) |
|
01/06/2016 |
On-Demand course retention dashboard removed |
Retention statistics no longer available for on-demand courses. (‘[External] Coursera Product Updates for Edinburgh - Google Docs’, n.d.)
Improved tools are incoming but as of the study’s completion date not available.
|
The Coursera platform provides a number of statistics for each course such as the number of learners who visited the course page and the number of certificates awarded, etc. A number of metrics were created based on previous work (Table 3) to enable comparison of retention across the session based courses. The session based courses also feature entry and exit surveys with standardised questions utilising the Coursera quiz function.
Demographic data for each course is provided by Coursera however there are a number of caveats to this data. Demographics such as age, gender and educational status are provided as estimates based on a periodic platform-wide survey (Coursera, n.d.). Due to the differing numbers of learners on each course, the estimate is provided along with an accuracy estimate in percentage points, which is equivalent to a 95% Confidence Interval (which we independently verified). Demographics related to location are estimated by Coursera based on Internet Proxy resolution and may not always be resolved to a specific country. The data available to researchers is the percentage of course users from a country or continent. There is no associated error estimate for regional data. Given the variation in timings of the courses we did not think it was appropriate to formally test differences in means across courses for demographic data but have highlighted where differences exist outside of the 95% Confidence Interval. Means generated from our own evaluations were compared via Tukey’s post-hoc comparisons in R Studio Version 0.99.903.
Table 3: Comparable metrics across MOOCs
|
Measure |
Definition |
Reference |
|
Active Class Size |
Average number of students viewing each lecture. |
(J. R. D. MacKay et al., 2016) |
|
Max Learners |
The number of learners who have ever engaged with a lecture |
Coursera Supplied Metric |
|
Retention (Session Based) |
Number of students received a certificate of achievement |
|
|
Drop off Point (Session Based) |
First week where less than 50% of students who visited a course watched a lecture |
Novel Measure |
|
Drop Off Rate (Session Based) |
Proportion of lectures viewed by more than 50% of the students who visited the course. |
Novel Measure |
|
|
|
|
The on-demand courses offer learners an opportunity to leave ‘stories’ about their experience. Given that students are encouraged to leave these as ‘stories’ after completing the course, they were frequently complete, short narratives about the learner’s experience. Small stories describing recent events can be very informative about a person’s engagement with an event, and can be categorised as the person describing their own version of ‘breaking news’ (Georgakopoulou, 2006). These small stories also frequently involve the projection of future events which we might consider very important in the formation of behavioural change that might result due to a MOOC experience. An episodic style analysis focusses on the goal-seeking behaviour exhibited during stories (Smith, 2000) which may tie in to a self-determination model of human behavioural change due to demonstrating the learner’s own autonomy and internalised learning (Ryan, Patrick, Deci, & Williams, 2008). We therefore considered these stories suitable for a narrative analysis, with the assumption that they would be sampling a specific cross-section of the MOOC-taking population who had successfully completed a MOOC and were motivated to tell the instructors what they felt about it. All narratives were read and categorised by author JM and interpretations were reviewed by author KH. Narrative analyses consider the structural properties of the text (Franzosi, 1998) and so when analysing the text, the themes were generated from the data in terms of how they informed the story the learner was relating to the user, following Silverman's (2014) example of identifying important agents or events. The themes were summarized in terms of attributes of the learner, as an actor in their story, attributes of the course as the ‘event’ which occurred, and attributes of the teaching/institution as another agent within the narrative.
The overall size and activity of the courses are given in Table 4. Of the session-based courses, the first Animal and Equine courses were largest. On average, only 65.4% of the total learners registered on a session based course actually visited the course pages, and only 2% of the total registrations paid for the signature track certificate. Across all session based courses, 22.9% of total registered learners were active within the class, although there was variation across courses. For the on-demand courses, approximately 26.9% of the total learners were active on the courses.
Table 4: Summary statistics for session and on-demand MOOCs supplied by the Royal (Dick) School of Veterinary Studies
|
Session Courses (Sample Date: 03/08/2016) |
|||||||||
|
Course ID |
Total Learners |
Of which… |
|
|
|
|
|||
|
|
Visited Course |
Took Signature Track |
Max Class Size |
Active Class Size |
Forum Users |
||||
|
(N) |
(N) |
(N) |
(N±S.D.) |
(N) |
|||||
|
Animal 001 |
36550 |
61.4 % |
2.3% |
44.8% |
19.7% |
19.8% |
|||
|
|
(22443) |
(837) |
(16360) |
(7200 ±2455.1) |
(7242) |
||||
|
Animal 002 |
22948 |
66.8% |
3.1% |
46.8% |
18.8% |
18.7% |
|||
|
|
(15321) |
(700) |
(10733) |
(4319±1445.7) |
(4302) |
||||
|
Chickens 001 |
13581 |
68.3% |
1.6% |
55.3% |
29.7% |
21.3% |
|||
|
|
(9276) |
(219) |
(7517) |
(4036±1241.3) |
(2894) |
||||
|
EdiVet 001 |
11909 |
68.7% |
1.3% |
58.2% |
26.0% |
24.6% |
|||
|
|
(8187) |
(158) |
(6934) |
(3091±1088.4) |
(2934) |
||||
|
EdiVet 002 |
8822 |
69.8% |
2.1% |
58.7% |
26.8% |
25.7% |
|||
|
|
(6160) |
(187) |
(5177) |
(2360±840.0) |
(2268) |
||||
|
Equine 001 |
25493 |
69.4% |
NA |
66.4% |
35.5% |
0.8% |
|||
|
|
(17701) |
NA |
(16936) |
(9055±2837.6) |
(212) |
||||
|
Equine 002 |
15698 |
59.8% |
3.0% |
56.3% |
27.7% |
34.6% |
|||
|
|
(9387) |
(466) |
(8831) |
(4346±1386.1) |
(5438) |
||||
|
Equine 003 |
11803 |
63.9% |
3.6% |
50.3% |
24.3% |
30.2% |
|||
|
|
(7546) |
(430) |
(5940) |
(2868±875.6) |
(3560) |
||||
|
Average |
18351 (±9322.1) |
65.4% |
2.0% |
53.4% |
22.9% |
19.6% |
|||
|
(±S.D.) |
(12002±5798.0) |
(375±287.3) |
(9804±4558.6) |
(4210.6 ±2318.0) |
(3606±2115.6) |
||||
|
|
|||||||||
|
Course ID |
Total Visitors |
Active Learners |
Payments |
Course Completers (% of Total Visitors) |
|||||
|
Animal OD |
57111 |
23.2% (13247) |
1.5% (860) |
3.5% (1992) |
|||||
|
Chickens OD |
11984 |
25.1% (3011) |
1.8% (211) |
5.2% (622) |
|||||
|
EdiVet OD |
31653 |
32.3% (10211) |
1.3% (406) |
4.5% (1409) |
|||||
|
Average (±S.D.) |
26.9% (33582±18473.5) |
26.9% (8823±4292.5) |
1.5% (492 ± 271.9) |
4.4% (1341±561.4) |
|||||
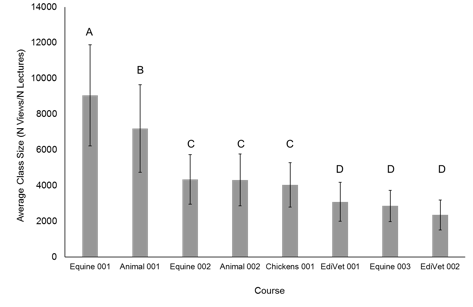
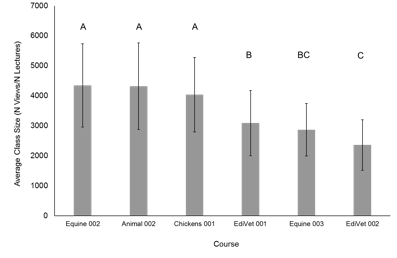
The active class size did not vary so much across courses as one might expect, with Equine 001 and Animal 001 featuring larger classes and both EdiVet sessions and the third Equine session being slightly smaller (Fig 1) in a Tukey’s Pairwise Comparison. Without these two large outlying courses, there remains no significant difference between the second sessions of Equine and Animal and the first Chickens Session, with a slight decline between EdiVet sessions one and two (Fig 2).
Figure 1 Difference in Average Class Size across courses, means grouped by Tukey Pairwise comparisons. Means which do not share a letter are significantly different.
Figure 2 Difference in Average Class Size across smaller courses, means grouped by Tukey Pairwise comparisons. Means which do not share a letter are significantly different
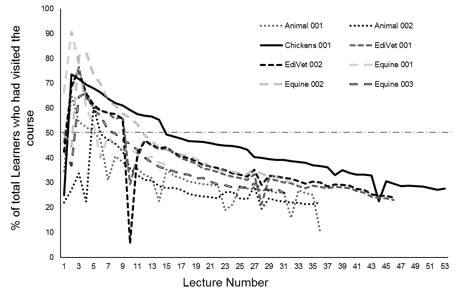
Retention, the proportion of learners who had sustained contact with the course, was challenging across all courses, but was not necessarily related to the length of the course. Fig 3 shows generally declining views of lectures, with troughs around the introduction videos, summary videos and archived hangouts, despite the general acceptance that these videos improve the learner’s experience (MacKay et al., 2014). The course which was able to retain the largest proportion of their students was Chickens, and it was the course with the most video material. Chickens also showed the shallowest drop off. Both Animal sessions lost 50% of their learners before the end of Week 1. Both EdiVet sessions lost 50% of their learners at the start of Week 2. The first Equine session lost 50% of its learners at the start of Week 3, with the following sessions losing 50% of their learners in Week 2 and before the end of Week 1 respectively. By contrast, Chickens lost 50% of its learners at the start of Week 3, on a par with Equine 001, several years earlier. The average retention rate across all lectures and sessions was 38.5% (±14.08).
Figure 3: Views as a percentages of all learners that have visited the course for each lecture
All four MOOCs attracted markedly more women than the Coursera average, with the course (session and on-demand) gender distribution shown in Figure 4. The Coursera userbase is 38.91%(± 0.04 estimated 95% CI) female, and Equine 001 showed the greatest discrepancy with 79.3 (± 1.93 95% CI) females. Equine 001 was itself more female skewed than the ensuing Equine courses and the other MOOCs. Animal 001 (70.2% ± 1.69 95% CI) and EdiVet 001 (69.5% ± 2.73 95% CI) had a similar female skew, whereas Chickens 001 showed the least female skew with 58.1% female learners (±3.1 95% CI). The majority of learners were in the 25-34 age range (Table 5) with the 35-44 age range being second most populous.
Figure 4: Distribution of gender across R(D)SVS MOOCs and Coursera Average

Table 5: Age distribution of learners across MOOCs offered by R(D)SVS
|
|
Animals |
Chickens |
EdiVet |
Equine |
|||||||
|
Course (± % Point Accuracy) |
001 ±2 |
002 ±3 |
OD ±4.2 |
001 ±3 |
OD ±7.4 |
001 ±3 |
002 ±4 |
OD ±5.1 |
001 ±2 |
002 ±3 |
003 ±5 |
|
13-17 |
0.3 |
0.4 |
0.2 |
0.2 |
0.6 |
0.7 |
0.4 |
0.0 |
0.30 |
0.4 |
0.4 |
|
18-24 |
12.0 |
10.0 |
10.7 |
8.0 |
5.7 |
14.0 |
9.0 |
9.7 |
8.0 |
13.0 |
11.0 |
|
25-34 |
38.0 |
40.0 |
32.0 |
31.0 |
23.0 |
35.0 |
35.0 |
34.0 |
27.0 |
37.0 |
28.0 |
|
35-44 |
19.0 |
18.0 |
20.8 |
20.0 |
18.2 |
19.0 |
21.0 |
22.9 |
17.0 |
20.0 |
19.0 |
|
45-54 |
15.0 |
13.0 |
13.1 |
19.0 |
23.1 |
16.0 |
17.0 |
14.6 |
20.0 |
14.0 |
20.0 |
|
55-64 |
10.0 |
9.0 |
13.1 |
13.0 |
20.9 |
9.0 |
9.0 |
12.1 |
20.0 |
12.0 |
14.0 |
|
65+ |
7.0 |
9.0 |
9.4 |
7.0 |
8.0 |
5.0 |
7.0 |
6.2 |
8.0 |
4.0 |
6.0 |
Most learners were European or North American (Figure 5) with some variation between courses, but on average across all courses 40% of learners were from North America, 34% from Europe, 13% from Asia, 5% from Oceania, 5% from South America and 3% from Africa.
Figure 5: Learner location across all MOOCs offered by R(D)SVS

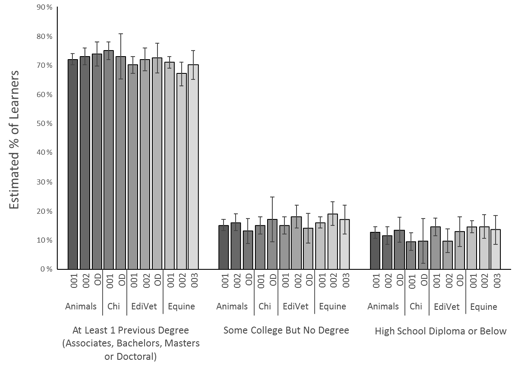
Most learners already had a degree (Figure 6) with an average of 25% of learners having achieved a postgraduate degree (Masters, or Doctorate degrees) across all MOOCs. Across all MOOCs, an average of 69% of learners described themselves as ‘not students’, and the majority were in some form of employment (Table 6)
Table 6: Employment status of learners across all R(D)SVS MOOCs
|
|
Animals |
Chickens |
EdiVet |
Equine |
|||||||
|
Course (± % Point Accuracy) |
001 ±2 |
002 ±3 |
OD ±4.2 |
001 ±3 |
OD ±7.4 |
001 ±3 |
002 ±4 |
OD ±5.1 |
001 ±2 |
002 ±3 |
003 ±5 |
|
Employed Full Time |
38 |
38 |
41 |
38 |
49 |
35 |
39 |
43 |
39 |
36 |
34 |
|
Employed Part Time |
13 |
13 |
13 |
14 |
9 |
12 |
14 |
14 |
16 |
14 |
17 |
|
Self-Employed (PT/FT) |
12 |
10 |
12 |
12 |
19 |
13 |
12 |
9.6 |
15 |
16 |
14 |
|
Unemployed and Looking |
14 |
15 |
14 |
14 |
3 |
17 |
12 |
12 |
8 |
15 |
14 |
|
Unemployed and Not Looking |
9 |
9 |
7 |
7 |
6 |
10 |
6 |
8 |
6 |
8 |
7 |
|
Other |
13 |
14 |
12 |
15 |
15 |
14 |
18 |
13 |
15 |
12 |
15 |
Fig 6: Educational attainment across learners in R(D)SVS MOOCs
The time that staff members spent on their courses was difficult to judge given the differences in video style, delivery, and the informal capturing of data. Dependent on the staff member the time spent on any given course could range from 2 to 150 hours. A survey of EdiVet staff members estimated that the course took 320 person-hours to create, although did not include time spent during the course. Animal staff estimated their course took 760 person-hours to create including estimates of time spent setting up the course page, designing custom interactive lectures using e-learning software and their time interacting with students using the forums and Google Hangouts. The materials are currently being utilised outwith the MOOCs as additional resources within the veterinary curriculum, as pre-arrival resources, and being incorporated into blended learning in both the veterinary and SRUC Animal Science curriculums. In addition some videos from the Animal MOOC were re-purposed for a secondary education ‘lesson in a box’ following revision to the Scottish Qualification’s Authority Higher Biology curriculum.
Staff tended to consider the filming of the videos both technically and logistically challenging but appreciated the high quality resource they obtained at the end. One staff member noted that:
We did opt for a specific look and feel – which as we know was more time consuming . . . The investment in time has been useful – since the videos are used to supplement teaching.
Staff were also concerned about the open nature of resources, and worried about their science being misinterpreted or applied in a way that may harm animals or people. The wide variety of learners was also seen as a common challenge with staff concerned about pitching the material at the right level. The positive experiences of the staff were mostly about overcoming these challenges, with staff stating they had gained confidence through the filming, learned more about digital education, and greatly appreciated the opportunity to widen access to educational materials.
The Royal (Dick) School of Veterinary Studies offers a number of postgraduate programmes in similar subject areas to the offered MOOCs and their undergraduate veterinary programme which is explicitly linked to the EdiVet MOOC. Although tracking was not formalised it is estimated that 6 out of 47 applicants to the Clinical Animal Behaviour MSc programme mentioned the Animal MOOC in their application statements.
For the undergraduate programmes in 2016 we received 1279 applications across our 5-year programme and 4-year graduate entry programme with a total of 170 places available across all programmes and funding schemes. In 2016, 12 candidates (<1% of applicants) mentioned the EdiVet MOOC in their personal statement.
Across the three on-demand courses, 195 student stories were posted. Excluding unfinished responses (such as “T-“) and non-English responses there were 58 useable stories in EdiVet, 23 useable stories in Chickens and 107 useable stories in Animals resulting in 188 useable stories in all. The narratives were overwhelmingly positive with 81.4% (n = 153) expressing some form of gratitude for the course and only 12.8% (n = 24) expressed no gratitude or mentioned that they enjoyed the course. The majority of these (n= 18) featured detailed descriptions of the learner themselves and so could have been considered ‘getting in touch’ with the teaching staff. The remainder still discussed the good quality of the teaching, mentioned the instructors or considered the information their course contained to be interesting. The most critical responses came from five stories, (Animals n = 3) where the course did not meet the learner’s expectations, such as:
“but I would have enjoyed it a teeny bit more if there was more in the 'Lions, Tigers, and Bears, Oh My!' section.”
-Animals“however I feel a lot of the information was not necessary for a small backyard flock”
-Chickens
These stories should therefore be considered as a subset of successful learners and not a cross-section of responses as more critical responses can be found within the discussion boards of each course. The vast majority of stories had identified what they wanted to do and were taking the course to help them get there, however there were two instances in EdiVet and one in Animals of people who had taken the course without a prior interest and then identified their desire to work with animals afterwards.
Several learners identified a barrier to their education, for example 11 mentioned ‘ease of access’ with four of these referencing financial challenges too. A further five learners perceived their age to be a barrier to their learning. Six learners mentioned financial barriers to their education. Veterinary education was considered unobtainable by these learners, such as the following example from an EdiVet learner:
“I am a woman that was on her way to being a veterinarian. I was enrolled in Animal Science in College, but was told it was a man's world and I should find another career. I believed it and was not strong enough at the time to go forward. […] Thank you for letting me have hope that I could have been a veterinarian. Maybe when I retire I can take a part time job at a clinic and be a positive influence there.”
-EdiVet
In these instances, the course could be seen as an achievement in itself or as a stepping stone to future learning with students identifying specific programmes or routes they wanted to take. A small number (4.8%, n = 9) of students identified specific programmes at Edinburgh University that they wanted to enroll on.
48.9% of stories considered the information they had learned to be interesting and praised elements of the course’s pedagogy such as the inclusion of relevant video clips and course structure.
Also it was nicely illustrated by local examples and good video's [sic] on farms and other places.
-AnimalsYour teaching was clear and simple yet on a knowledge level I would expect from a college course.
-AnimalsIt has been done with such precision and care, efficient and effective. Also, it is great that it was in written form under each video as I've saved the script to enjoy reading again after exams.
The learning experience was fantastic as there were many mediums to learn from.
-AnimalsThe teaching aids were apt and all my teachers explained their topics simply and coherently, they are versed and have in-depth knowledge in the areas they taught.
-EdiVetThank you and I'm sure I'll be watching again and again videos and materials I downloaded.
-EdiVet
The student’s perceived relationship with the instructors was notable in 15% (n = 29) stories with comments evidencing a perceived closeness with the instructors. In the Animals course the instructors’ pets were referenced several times as they were featured commonly in the teaching materials. In the Chickens course four of the five stories referencing instructor contact specifically discussed the learners perceived closeness with author VS, who featured most often in the videos and throughout the comments there were references to the instructors’ time being given as a ‘gifts’.
I appreciate the course instructors who took us through all these topics. They did a great work. They did very well.
i will love to be with them and work with them.
-AnimalI'll be coming to Scotland this summer! If you have any suggestions of things I can check out while I'm there, please let me know! I'm not sure if the University does tours or anything like that. Or if you have any suggestions in general on where to go from here, I'm open to that!
-AnimalI congratulate you for a job well done. You are an excellent speaker. Your voice, the excellent articulation and knowledge made it !
-ChickensMy teachers all had a friendly approach and it feels like I know them physically.
-EdiVet
The typical learner’s story sought engagement with the instructors, detailing why the opportunity for further learning had been important to the learner. The student often wanted to justify why they had taken the MOOC and why they had enjoyed it, and often highlighted how they expected their learning to affect them, either through the pursuit of further education, or in their day-to-day lives. A summary of the emergent themes and their frequency in given in Table 7.
Table 7: Emergent themes from the content analysis of learner stories from Royal (Dick) School of Veterinary Studies
|
|
Animals (n=107) |
Chickens (n=23) |
EdiVet (n=58) |
Overall (n=188) |
|
Learner attributes (how does the learner frame themselves as an actor in their story?) |
||||
|
Age perceived barrier |
1.9% (2) |
4.34% (n=1) |
3.44% (n=2) |
2.65% (n=5) |
|
Career change |
9.3% (10) |
17.3% (n=4) |
22.4% (n=13) |
14.3% (n=27) |
|
Financial challenge |
3.7% (4) |
0% (n=0) |
3.44% (n=2) |
3.72% (n=7) |
|
Future learning |
14.9% (16)) |
8.69% (n=2) |
12.0% (n=7) |
13.2% (n=25) |
|
Life long learning |
4.7% (5 |
0% (n=0) |
0% (n=0) |
2.65% (n=5) |
|
Outside Europe |
24 |
21.7% (n=5) |
29.3% (n=17) |
24.4% (n=46) |
|
Passion for animals |
42 |
47.8% (n=11) |
34.4% (n=20) |
38.8% (n=73) |
|
Practical application |
24 |
52.1% (n=12) |
13.7% (n=8) |
23.4% (n=44) |
|
Teenager |
1 |
0% (n=0) |
5.17% (n=3) |
2.12% (n=4) |
|
Next I will |
0 |
17.3% (n=4) |
8.62% (n=5) |
4.78% (n=9) |
|
|
|
|
|
|
|
Course attributes (what is the ‘Event’ in the story?) |
||||
|
Did not meet expectations |
4.7% (5) |
4.34% (n=1) |
1.72% (n=1) |
2.65% (n=5) |
|
Ease of access |
5.6% (6) |
0% (n=0) |
8.62% (n=5) |
5.85% (n=11) |
|
Enjoyed course |
40.2% (43) |
21.7% (n=5) |
37.9% (n=22) |
37.2% (n=70) |
|
Gratitude for course |
80.4% (86) |
86.9% (n=20) |
81.0% (n=47) |
81.3% (n=153) |
|
Info interesting |
43.9% (47) |
47.8% (n=11) |
46.5% (n=27) |
45.2% (n=85) |
|
Met expectations |
2.8% (3) |
8.69% (n=2) |
1.72% (n=1) |
3.19% (n=6) |
|
Outside university input |
0 |
8.69% (n=2) |
0% (n=0) |
1.06% (n=2) |
|
Taster |
0 |
0% (n=0) |
3.44% (n=2) |
1.06% (n=2) |
|
|
|
|
|
|
|
Institute/Teaching attributes (who are the other agents in the story and what are their characteristics?) |
||||
|
Edinburgh University |
||||
|
Future study at Edinburgh |
4.7% (5) |
4.34% (n=1) |
5.17% (n=3) |
4.78% (n=9) |
|
Past study at Edinburgh |
0 |
0% (n=0) |
1.72% (n=1) |
0.53% (n=1) |
|
Reputation |
0.9% (1) |
4.34% (n=1) |
6.89% (n=4) |
3.19% (n=6) |
|
Teaching |
||||
|
Bad quality |
1 |
0% (n=0) |
0% (n=0) |
0.53% (n=1) |
|
Good quality |
41 |
52.1% (n=12) |
25.8% (n=15) |
36.1% (n=68) |
|
Instructor contact |
14 |
21.7% (n=5) |
17.2% (n=10) |
15.4% (n=29) |
To our knowledge this is the largest long-term summary of a range of science MOOCs, and therefore the findings are diverse. We consider our results in context of the research questions: How class size, retention and drop-off compare across a range of courses over time; and how effective the MOOCs could be considered in terms of building sustainable educational resources and widening participation in veterinary sciences.
There are a number of limitations to the study. The conclusions of a study may be questioned if there is doubt that the study has properly addressed the natural variation in the population, failed to account for a confounding variable, or is biased in a way that there is a systematic error in the data. In terms of natural variation in MOOC users, this study covers over 140,000 course registrations over a period of three years, although readers should not conclude that these are unique users. Given the rapid rise and fall of MOOCs, the earlier courses may not be representative of the present MOOC student population. This study is also confounded in that the study considers only veterinary science MOOCs, and so there may be something about the veterinary science subject which attracts a certain type of learner. In one study, a comparison between a classics MOOC and a STEM MOOC found no difference between student forum engagement (Ntourmas, Avouris, Daskalaki, & Dimitriasdis, 2018). Veterinary students are often considered to be highly motivated (Zenner, Burns, Ruby, Debowes, & Stoll, 2005) and many who work with animals feel ‘called’ to such work (Schabram & Maitlis, 2016). The narrative analysis’ strong theme of gratitude may reflect this ‘calling’, as recent work has highlighted that those working with animals feel under-resourced (Stavisky, Brennan, Downes, & Dean, 2017). The gender bias is certainly reflects what is observed within the veterinary profession (Buzzeo, Robinson, & Williams, 2014). Therefore, we may expect different findings outside of the veterinary field. Finally, the data presented here may be systematically biased. There are many biases to the quantitative data detailed extensively in the methodology such as the changes to the platform (Table 2) and chosen metrics (Table 3), and we hope this detail will allow future MOOC studies to critically evaluate the results discussed here. The narrative analyses in particular are greatly biased by coming only from completers, and student intent, an important consideration in MOOC evaluation (Reich, 2014), could not be considered in this type of large retrospective study. With these limitations in mind, we consider our findings in terms of the UUK’s ‘Mission, Recruitment and Innovation’ framework.
The role of these MOOCs in communicating scientific knowledge and raising the department’s profile is complicated by the recurring MOOC issues of retention. In terms of serving as a ‘shop window’ for the school, the MOOCs could be said to be successful, as seen by the high completion rates for session and on-demand courses, and the numbers of students who identified a further desire to study the subject. However this can only be said of those students who were engaged with the platform. Retention remains extremely challenging. The novel drop off rate and drop off point measures calculated in this study were surprisingly similar across all of the session-based courses and the proportion of total learners who finished the on-demand courses ranged from 3.5% to 5.2% across the three on-demand courses. Again the value of retention is called into question when considering the stories which discussed their future learning. While a number of students were able to identify changes to their own practices they would make or (word missing here?) their desire to continue learning, the process of learning was valued above the attainment of the certificate. This may be a positive outcome as the certificate, at least for these MOOCs, was not credit bearing, and so it is good to see that undue importance was not being placed on that achievement. Educational investment has diverse pay-offs and varying effect sizes across different demographics (Hout, 2012). One of the main achievements of these MOOCs may be the introduction of these topics as sciences to audiences who may be less familiar with applied sciences. With 45% of the learner stories explicitly referencing how interesting they found the subject matter, these MOOCs could be characterised as successful in their mission to further veterinary science education.
However, the demographic data, particularly the high proportion of students from the western world who were highly educated reflects recurring concerns that MOOCs do not greatly impact widening participation drives (Markoff, 2013), and indeed may simply appeal to those already well-educated (Laurillard, 2016). Within the veterinary industry we know that students from less developed countries face significant barriers to accessing so-called ‘open’ education, particularly when the delivery method is digital (Gledhill, Dale, Powney, Gaitskell-Phillips, & Short, 2017). While these MOOCs were extremely positive experiences for those students who took them, it cannot be said that they were equally effective across all demographics, given the distinct bias in the platform’s audience.
These MOOCs had mixed success around diversifying recruitment backgrounds to science higher education. Recent criticisms of MOOC research have suggested that few implications for teaching and learning have emerged from the body of work (Reich, 2015). A particular criticism is that evaluations can focus on the metadata such as view counts etcetera without exploring what goes on inside the heads of students. The quantitative results of this study, albeit focusing on the Coursera MOOC platform, suggests that the overall MOOC demographic meets the Western Educated Industrialised criteria of the WEIRD population. Inevitably this suggests these courses are not so wide reaching as we might hope (Henrich, Heine, & Norenzayan, 2010). One of the great successes of the MOOCs in this study is their ability to reach a wide female audience. The difficulties surrounding getting women to remain within STEM fields is well publicised. While animal related sciences are often perceived as ‘soft sciences’ this belies the complex and robust study designs required in the field (Lund, Coleman, Gunnarsson, Appleby, & Karkinen, 2006) and we would hope that the prevalence of female tutors on these courses might serve as ‘role modelling’ (Blickenstaff, 2005) and encourage retention of women in STEM. While we were not able to collect post-course data in this study previous work has not shown a difference in retention rates between men and women in these courses (MacKay et al., 2016). It is interesting to compare the recruitment lessons from the quantitative aspects of this study and the qualitative aspect. Learner stories often described a student population ‘desperate’ for the opportunity to learn, either to meet a self-set challenge such as a career change or because access to learning is more difficult for their demographic. This supports the oft-mooted ideas about MOOCs widening access to education (Lane, Caird, & Weller, 2014). In terms of recruitment, MOOCs may have an important impact for some individuals, but again the platform reflects a similar western bias we see in many educational resources, and this may not be replicated at scale. While MOOCs are still valuable for widening access to education, as highlighted by the student stories, they are not a true solution to the accessibility problem.
Finally when considering MOOCs as a teaching innovation in science education we may see a more positive outlook. The resources were praised for their quality and have been utilised outside of the MOOCs and in other schools and institutes internationally (MacKay et al., 2016). Many of these uses come not from the Coursera platform but from the school mirroring its resources on video sharing sites such as YouTube and now on the university’s own video sharing site. The staff often felt their teaching ability had improved after filming and found the creation of materials to be a rewarding process both in terms of their own development but also in being able to interact with a large number of students, often from different backgrounds than what they were used to. The perceptions of the relationship between staff and learners would be an interesting further route of study as it was commonly perceived as a valued relationship for the learner, much as Watson (2016) noted. It should not be surprising that a pedagogy built from connectivist principles should value social interaction, but the tendency for digital interactions to build strong unilateral social bonds (Kjus, 2009) and the occasionally reported harassment of staff encountered on some MOOCs (MacKay et al., 2016), presents a risk to engaged staff members that they may not always be aware of.
A further innovation that should be considered is the platform itself. Many of the most positive engagements, such as utilisation of the materials outside of the MOOC context, and the difficulties surrounding retention may suggest that MOOC platforms are due for innovation. The utilisation of other video platforms, such as YouTube, have been considered for the delivery of higher education, but there is a great deal of concern surrounding the provision of accurate information (Clifton & Mann, 2011; Fernandez et al., 2011). With regards to Mission, Recruitment and Innovation, many of the successes noted here could feasibly be achieved through hosting the materials in playlists on alternative, open platforms. Currently YouTube channels such as Kurzgesagt and Crash Course regularly obtain upwards of a million views on their educational materials (‘CrashCourse’, n.d.; ‘Kurzgesagt – In a Nutshell’, n.d.) despite no formal affiliation with higher educational institutes. Attaining even a small fraction of this success would massively impact a university’s mission, recruitment and provide innovative learning opportunities across their programmes and in their outreach. The final lesson therefore is that innovative teaching can be rewarding for staff and students, but may not require the MOOC framework to achieve the same results.
In conclusion, we find that these science-based MOOCs were highly successful at reaching thousands of engaged learners, however, the limitations of the platform’s reach, and its continued commercialisation reduced the efficacy of MOOCs in providing truly open and accessible education for all. Universities should continue to provide resources at a variety of levels, but explore whether different video platforms would be more successful in engaging learners across the world, and at differing levels of education. Universities may be better placed investing these resources in truly open stand-alone materials for other video platforms.
This research did not receive any specific grant from funding
agencies in the public, commercial or not-for-profit sectors.
Jill MacKay is a Research Fellow in Veterinary Medical Education at the Royal (Dick) School of Veterinary Studies. Jill is interested in the evaluation of educational methodologies and student experiences in digital environments.
Jessie Paterson is a lecturer in student learning at the Royal (Dick) School of Veterinary Studies. Her research interests include transitions into university, academic student support and peer support.
Victoria Sandilands is a senior scientist in poultry behaviour and welfare at Scotland’s Rural College
Natalie Waran is Executive Dean and Professor (One Welfare) at the Faculty of Education, Humanities and Health Science at Eastern Institute of Technology in New Zealand.
Bryony Lancaster is the programme manager for the distance learning MSc in Equine Science at the Royal (Dick) School of Veterinary Studies and a teaching fellow.
Kirsty Hughes is a research assistant in veterinary medical education at the Royal (Dick) School of Veterinary Studies.