Claire Donald, Elizabeth Ramsay and Inken Joerg, University of Auckland, New Zealand
In recent years the deployment of MOOCs (Massive Open Online Courses) has come under close scrutiny by tertiary administrators and educators, as thousands of learners engage with (and ‘drop in’ and ‘drop out’ of) hundreds of MOOCs offered by tertiary institutions worldwide (Shrivastava & Guiney, 2014). The original 2008 MOOC, created by Downes and Siemens at Athabasca University, also known as a ‘cMOOC’, facilitated networked learning between learners who connected with one another across open software platforms to share their knowledge. The main variant to the ‘cMOOC’ was the ‘xMOOC’, which was based on a transmission model, mainly using video lectures and automatically marked quizzes, with minimal interaction between participants (Bates, 2014). However, since the ‘Year of the MOOC’ in 2012 (Pappano, 2012), the nature and design of MOOCs and how they are delivered has evolved rapidly. Critiques and reviews of further teaching experimentation with the various types of MOOCs report that the multiple pedagogic forms and intentions of MOOCs that have emerged make a binary classification impractical for learning designers and educators (Bayne & Ross, 2014; Conole, 2014). MOOCs now represent a diverse range of open educational resources, hybrid MOOCs and formal courses (Anders, 2015; Conole, 2015).
In a review of the MOOC literature from 2013 to 2015, Veletsianos & Shepherdson (2016) conclude that there is a paucity of research examining instructor-related topics on MOOCs. Questions are being asked about the experiences and perceptions of instructional staff in the development and delivery of MOOCs, and what is expected of academics in providing high quality learning experiences for thousands of students.
Our paper addresses these questions with reference to a FutureLearn MOOC that was developed at the University of Auckland on introductory statistics, called Data to Insight (D2I). We report on what teachers and learning designers experienced during the development and delivery of the first two course runs, as well as feedback from participants. The lessons learned extend our knowledge and evidence base for learning design and facilitation of particular kinds of MOOCs, and by extension are also applicable to some campus-based and online learning environments.
Learning design is both a process and a product. Learning design-as-process is what teachers and learning designers do, while learning design-as-product is what they produce as the outcome of this process (Masterman, 2009). Citing several authors, Donald, Blake, Girault, Datt and Ramsay (2009, p. 180) capture this dual meaning by defining learning design as:
a product (that) documents and describes a learning activity in such a way that other teachers can understand it and use it (in some way) in their own context. Typically, a learning design includes descriptions of learning tasks, resources and supports provided by the teacher. Learning design is also the process by which teachers design for learning, when they devise a plan, design or structure for a learning activity.
Learning designers and tertiary teachers commonly use an iterative approach to building learning resources (Agostinho, Bennett, & Lockyer, 2016) such as resources for a blended course, or a fully online course, a MOOC, or open educational resources. A common first step is to build representative prototypes on key topics or learning activities, which are piloted with test users, and adapted based on the results. Depending on the scope of the project, this may require a multidisciplinary team of technical (e.g. web developers, computer programmers), audio-visual (e.g. videographers, graphic designers, animators) and educational specialists (teachers, learning technologists, learning designers) if the educational resource includes videos, audio, or animation to a broadcast standard. The culmination of the piloting phase is the establishment, by consensus, of the pedagogical model. This functions as a mission statement, communicating a shared understanding amongst the development team of the core learning and teaching approaches and associated methods that will be replicated adaptively across all the topics of the course. Establishing the pedagogical model is a key product of, and a watershed moment in, the learning design process. One main aim of this paper is to describe the pedagogical model for the D2I MOOC, for learning designers and educators to assess whether it can be applied sustainably to other MOOC designs.
Our teaching goals, early on, were to give learners opportunities to choose a statistical topic of interest, explore some data, either provided or their own, and then discuss their interpretations and conclusions with their peers and teachers. An initial look at the features of the FutureLearn MOOC platform, with its four elements of videos, articles, quizzes and discussions, to be sequenced in linear steps within weekly activities, was discomforting in view of these goals. The lead educator[1] wanted to produce a unique introductory statistics course that would give learners, who were novices at data analysis, the skills to find and extract accurate information from large, complicated data sets. It was immediately apparent that taking advantage of such a platform for the benefits of teaching an international audience on a world stage would require some design compromises.
Rather than be constrained by the learning platform, our challenge was to maximise its features and ‘bend’ its structure to our design ‘will’ so that learners could engage with rich, integrated resources and crafted exercises, in learning sequences well aligned with assessment tasks.
As we discovered, MOOC pedagogy is not embedded in the MOOC platform. The learning design process involves using the functionality of the platform to create a pedagogical model that represents the educators’ preferences and beliefs (Bayne & Ross, 2014). How we did this is not immediately apparent when looking at the available learning activities of the course, but the design is evident in the pedagogical model, which is embedded in the structure and sequence of resources and supports. It frames and directs the learning process when learners engage with the learning tasks. Some representative learning sequences are presented in Figures 1-3 below.
In pedagogical terms, our goal was to socialise learners into ways of statistical thinking, providing them with learning opportunities to acquire such thinking skills (Brown, 2004). We hoped that learners would be actively involved in individual and shared tasks that built on their prior knowledge, stimulated by new ideas and ways of problem-solving, while being encouraged to reflect individually and jointly on their new understanding. We therefore expected to be able to use a blend of social constructivist, cognitive and connectivist pedagogical approaches based on philosophies of constructivism, conceptual change, networked learning and distributed knowledge (Conole, 2015; Stewart, 2013; Siemens, 2005).
The lead educator wanted learners to “find the stories (features, patterns and relationships) that improve our understanding of the way our world works. This can enable us to make better decisions and operate more effectively.”[2] He was already using dynamic, interactive data visualisation in statistics education, and had co-led the University’s first-year statistics teaching team to a national Tertiary Teaching Excellence Award in 2003. The course proposal was innovative and ambitious. The intended learning outcomes were that students would learn to:
understand the basic principles of interpreting statistical data,
develop skills to interpret visual representations of data, and
learn to use new statistical software (“iNZightVIT”[3]) to produce visualisations of statistical data sets.
It was intended that learners would learn through:
explanations and demonstrations,
exercises where they produced graphs from (their own or given) data (using iNZightVIT) and practised interpreting the graphs they produced,
quizzes and tests on the accurate interpretation of similar statistical graphs to those in the exercises, and
discussions by interest groups on each activity.
This fairly non-traditional, social constructivist approach to teaching an undergraduate statistics course seemed, to us, to resonate with that of the FutureLearn Consortium, whose mission is to “pioneer the best social learning experiences for everyone, anywhere” with invitations to prospective learners to “learn anything” to “learn together” and to “learn with experts” by “meet(ing) educators from top universities and cultural institutions, who (would) share their experience through videos, articles, quizzes and discussions.”[4]
The main learning challenges we foresaw were that learners would need to install statistical software from the web, and do the exercises using the iNZightVIT software to support the development of fundamental, applied and abstract concepts. The learning design challenges were therefore to support the learning of statistical principles and methods by means of rich media (for example video with motion graphics), interactive exercises, and effective automated feedback. The educators would also need to be actively present throughout the course to guide and facilitate the process and discussion with a massive and unknown learning community.
The first year of development and implementation of the D2I MOOC was a teaching project that required a large, interdisciplinary development team of approximately 20 academic and specialist professional staff from several departments working in collaboration with the FutureLearn team in the UK. The ten-month design and development period preceding the first course run of the D2I MOOC was highly pressured. This was the first MOOC developed at the University of Auckland and the teaching team were new to online learning and teaching.
From a course development point of view, there was the requirement for a multidisciplinary team who had not worked together before, to develop a brand new, high profile, public course in an unknown teaching environment, on an unfamiliar software platform, within a tight and fixed timeframe. Early on, it became apparent that the customary learning design process of rapid prototyping in iterative cycles from proof of concept, to user-testing of a working prototype, to the launch of the final product (Caplan, 2004), would be unachievable, as the emerging status of the FutureLearn platform at that time made user-testing almost impossible. Piloting and prototyping different designs to meet our educational goals therefore required that we devised a work-around mechanism. With limited time to act on the feedback from these crucial pilot sessions, we prioritised what feedback we could for the final specification.
In preparation for a ‘massive, faceless’ adult learning audience, we designed the course based on broad principles of adult learning, that is, that adults learn best when they approach learning as a transaction (Knowles, Swanson, & Holton (2011) which involves them being active, self-directed, and challenged by problems that relate to their experience, and which they perceive are relevant to their needs (Brown, 2004). Secondary school maths teachers from NZ who were teaching a new statistics curriculum at that time, were one of the key audiences.
A number of high-level decisions were made prior to the pedagogical model being finalised, such as the decision to produce high quality motion graphics and high definition teaching videos of broadcast quality. These had costly time and resource intensive implications for the project. Many hours were required for sophisticated graphic design, working with a third party transcription service provider while adding closed captions to the videos, and producing additional illustrated transcripts ourselves, for accessibility; and coaching the educators to teach to camera.
One of the learning designers reflected on this phase of the project:
Any hopes for the launch date to be postponed, or for the volume of content to the cut, remained night-time wishes as there could be no deadline extensions or scope reduction. Approaching the launch date, development and production intensified. The usual phases of design, development and implementation felt more like ‘wading through mud’, and a ‘mad scramble’.
This intensity was echoed by one of the educators:
It was a dangerous process. There was no room for error.
As noted, the proposed teaching approach was to facilitate special interest groups around topics of interest, where learners could use their own data and ask questions. This would require that learners posted their own images (such as screen captures of graphs and other data visualisations), and that learners would work in groups. They would use the iNZightVIT software to generate and share visualisations of their data and discuss their interpretations. However, this functionality was not available within the four design elements available on the FutureLearn platform at the time[5], which were limited to video or audio, articles, quizzes and tests[6], and asynchronous discussion. Although learners and educators could post comments alongside each section or ‘step’ of a week’s learning materials (except the quizzes and tests), and these comments could include hyperlinks, images and graphics could not be posted. Therefore, the course moderators could not set up group work or streams on the platform as originally intended. It was up to learners to organise their own study groups or special interest groups (on external social media platforms).
We settled for an approach where, in the first half of the course, new statistical concepts and skills were taught, as well as how to analyse and visualise large data sets. In the second half of the course, more challenging concepts were taught. These were introduced in the form of problems for students to solve. Many of these problems were philosophical issues for students to grapple with, such as the reliability of data and how to interpret it as accurately as possible. The final MOOC design comprised an eight-week course with materials, tasks and activities to support 24 hours of online study time, at an estimated[7] three hours per week. The course components are listed by week in Table 1.
Table 1: D2I MOOC scope and content
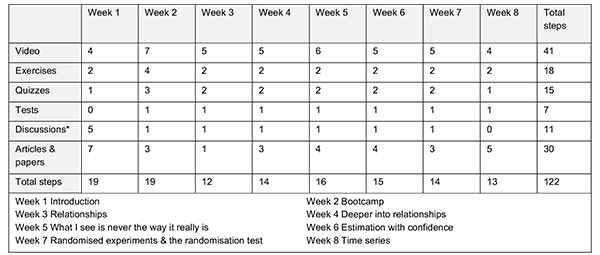
* ‘Discussions’ in FutureLearn terms are ‘steps’ like the articles or videos. These are different to ‘comments’ that can be made alongside all steps except quizzes and tests, and generate hundreds of discussions in the more generic sense.
The inevitable compromise and adaptation from the intended to an achievable learning design (product) therefore followed. We compromised on some fundamental learning design principles (e.g. group work as explained above) while aiming to deliver a high quality MOOC that would be fit for purpose. Essentially we aimed to help students learn about new statistical ideas and skills, collaboratively or not, as needed, with regular tests and checks of their knowledge and skills as they progressed through the course.
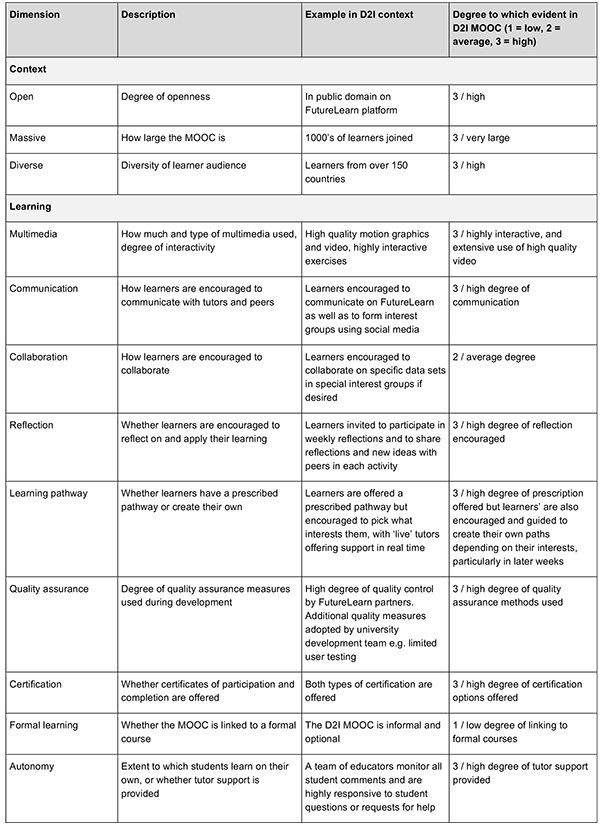
We have described the D2I MOOC as a highly structured MOOC using broadcast quality videos and animations to teach introductory statistics. For educators’ purposes, it is more useful to use a MOOC classification schema such as that proposed by Conole (2014, 2015), and make a high-level comparison of the learning design to other MOOCs. Conole’s 12-dimensional schema includes three contextual and nine learning dimensions to categorise five different pedagogical approaches; associative, cognitive, constructivist, situative or connectivist. The associative approach focuses on the individual learner, presenting knowledge and tests of that knowledge via stimulus and response. The cognitive approach takes the learner’s current level of experience into account and offers learners different stimuli to reflect on their learning as their experience grows and develops. The constructivist approach builds on prior learning, offering active, task-oriented methods such as problem-solving for the learner to build new knowledge. The situative approach emphasises learning in context through dialogue, while the connectivist approach encourages learning through reflection in a networked, distributed community of peers, where each build their own personalised learning environment. With most of the 12 dimensions in Conole’s MOOC classification schema being evident in the D2I MOOC to a high degree, the D2I MOOC could be categorised as having a cognitive pedagogical approach, due to the emphasis on “learning by experiencing stimuli, with learners encouraged to contemplate on their learning” (Conole, 2015, p. 242). We elaborate on the descriptors of this ‘cognitive’ MOOC with examples from the D2I MOOC for each dimension in Table 2.
Table 2: The D2I MOOC design according to Conole’s (2015) MOOC classification schema
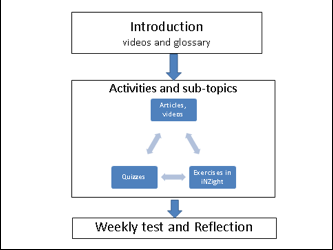
The high-level pedagogical model is shown in simplified form in Figures 1 and 2. Each of the eight weeks has an introduction and four to five activities, which culminated in a test and an option for a weekly reflection.
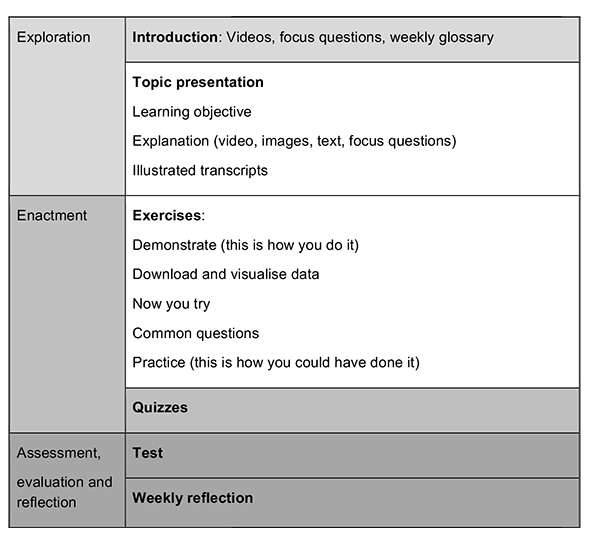
Figure 1: High level pedagogical model for the Data to Insight (D2I) MOOC
Figure 2 illustrates the weekly learning activities. This involved an exploration of a new topic, enactment (with several explanations and exercises), and then assessment, in a process of ‘chunking learning’ as the educators called it. Depending on the topic, this process of exploration, enactment and assessment was offered in cycles, each focused on a limited number of learning objectives, with many opportunities for learners to ‘see a little, do a little’.
Figure 2: Weekly structure of D2I MOOC
Each MOOC learning activity is introduced with its learning objective followed by an explanation of the key topics using videos with illustrated transcripts, articles, and a glossary of the new terms used that week. Most explanations have focus questions to alert (before viewing) and remind (after viewing) learners of key points. The exercises typically invite learners to try a new statistical method with supplied data sets. A demonstration often follows of how they could have done it (with illustrations), with a list of questions commonly asked by learners, and then practice exercises using the iNZightVIT software where learners can also use their own data. Exercises conclude with a practice quiz.
The week’s final test is followed by a ‘weekly reflection discussion’ which encourages learners to discuss their week’s learning experience and share reflections on the final test. Learners have the opportunity to comment and post questions at any time along each ‘step’ (except the test) of their learning process.
We have borrowed notation from the Learning Design Visual Sequencing (LDVS) format (Agostinho, 2011) to depict a learning sequence that a learner might undertake during the fifth week (assuming they would follow the sequence as offered) in Figure 3. This represents the learning activities from the learner's perspective, with associated resources and supports (Oliver & Herrington, 2003).
![]()
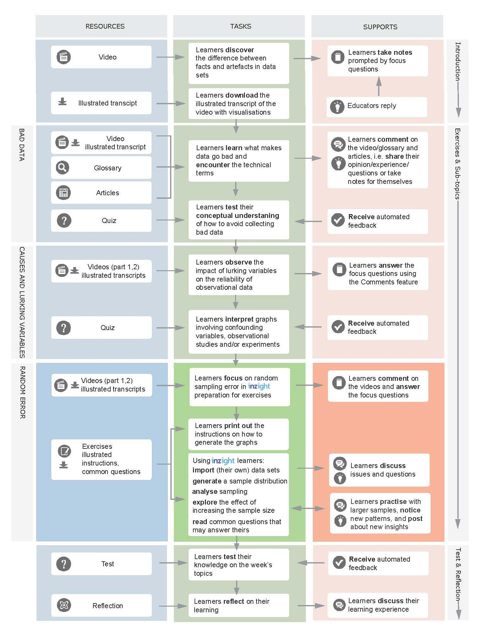
Figure 3: Example of a learning sequence in D2I MOOC from Week 5 (notation after Agostinho, 2011)
The verbs in the Task and Supports columns in Figure 3 denote activities a learner would engage in, such as “learners discover….”, “learners take notes …”, “learners interpret …, test ., observe..., take notes …, discuss ..., test..., practise ...,” etc. Learner engagement with a) the weekly glossary and b) the quizzes and tests are two noteworthy examples of such learning activities:
a) The weekly glossary
Language was a big issue to address because learners were from a vast array of backgrounds and experience, the English medium of instruction was not the first language for many learners, the educators could not ‘see’ these learners, and there are subject-specific statistical terms that are also used in everyday language, such as ‘significant’, ‘interval’, or ‘error’. The glossary was a way to communicate the intended meaning or formal definitions of these words. We provided the entire glossary in the final eighth week of the course, but also broke it up into a ‘weekly’ glossary, where a subset of terms that were relevant to that week were included in an early ‘step’ each week. The glossary was maintained primarily by the educators. Learners were invited to suggest new terms for the glossary, as well as any clarifications to the definitions.
This was our attempt to introduce new terms each week so that they were less overwhelming for learners. The terms were then also explained at various points in the course via weekly emails. With the ‘comments’ feature active alongside each weekly glossary, some learners expressed their appreciation of this early ‘heads up’ or introduction to unfamiliar terms, while others found it to be premature, thinking they were required to learn the definitions out of context. They needed assurance from the educators that the explanation of the glossary terms early on was for reference purposes and that they would be explained in context as the lesson sequence unfolded.
b) Quizzes and tests – where the correct answer is false
The quiz and test questions were designed to reinforce true statements, with questions asking learners to ‘spot the wrong answer!’ These had multiple correct options and only one false option for learners to identify. Learners were unaccustomed to searching for false rather than true options, which was exactly what the educators intended, as most of the quiz and test questions were about data visualisations that learners had to scrutinise closely (Wild, Triggs, & Pfannkuch, 1997). This led to some confusion for learners due to double negative statements. During the first course run some learners commented on the challenges of this. For example:
I found the quizzes tricky – I feel that I spend more time trying to understand the wording and what the question is asking rather than being tested on understanding of the course material.[8]
Others appreciated how powerfully this aided their learning:
The questions with the true/false can be challenging at times. I can get distracted and miss an interesting aspect of the data. The explanations for an error make for fantastic learning opportunities. Thanks for so precisely and succinctly explaining the incorrect/correct responses.[9]
For the second course run, the educators made slight adjustments to the questions to improve clarity, but retained the format of the quizzes. The lead educator added a page explaining the rationale for this in more detail:
… if you treat it as a learning opportunity then the true answers are much more important than the false ones. They have been provided to help you start looking closely at graphs and learn to pick up on features of the graphs that are actually there. And their feedback has been provided to reinforce those messages. … So … think, ‘This is the part of the course where I practise looking really hard at data and getting a better idea about what I can see in it.’
Yet the course facilitator still commented in the post-course team debrief that “despite trying to say that these ‘tests’ were really just learning opportunities and not to fixate on scores, we still found that people got quite upset when they did poorly especially in week 6 – and perhaps gave up and did not do week 7 and 8.”
Despite this, we were encouraged to see that this strategy of testing for false rather than true items was listed among the learning design guidelines for writing good quiz questions on the FutureLearn Partners website, with reference to the D2I course, soon after the first course run. This was promoted as a potentially effective method to employ for encouraging higher-order thinking skills of evaluation and understanding[10], which can be difficult to achieve with multiple choice questions.
Completing participants responded positively to both course runs. Post-course survey responses indicate that the videos, animations and quizzes were the most popular course components. Learners commented on the MOOC’s production qualities: its “beautiful visualisations” that “brought statistics to life in a way that 2D graphics just can’t”, on the way activities “solidified” the concepts, leading to “seeing and understanding statistics in a refreshingly new way”.
I am fascinated by why this MOOC is keeping me so engaged – it's not the social learning because I only ever bother with that when I get to the end of the week. I think partly it's the opportunity to find out about stuff and then actually apply it with the software. Really well done![11]
Most respondents (95%) rated the overall learning experience as very good (73%) or good (22%), noting the value of the links to related content, the ability to download the videos, and to have written transcripts. Departing comments in the final ‘farewell’ or Haere ra (in Maori) step of the course (Step 8.13) also showed high levels of appreciation for the course’s (free) iNZightVIT data-visualisation and analysis software. Learners found the course to be very well structured, and for most respondents, the course exceeded their expectations. Many maths teachers, as well as professionals from a wide range of other sectors, said they intended to reuse the course materials with their professional communities.
We do not know how representative this learner feedback is, as only 3-5% of (presumably completing) learners fill in the post-course surveys each year. However, an analysis of learner comments that were made during each week shows that most were positive. One of the common reasons cited by learners for a positive learning experience was the high level of engagement by the lead educators. For example (two of many unsolicited learner comments):
Just a quick one to say a massive thank you to Chris and his wonderful team for this course! I had many Eureka moments throughout and you made many complicated concepts understandable and clear! The visual tools were amazing and I will use Inzight in future! I enjoyed this course tremendously. Can I just ask whether you are planning any more (possibly more in depth) data analysis courses in future? I would enroll definitely! Thank you![12]
… I was also very honored to have Chris and Tracey reply to my questions and comments on the occasions when I was less sure…[13]
The learning design experience of the D2I MOOC provided not only disconcerting challenges and, at times, disappointing compromises, but also some valuable lessons:
1. Explanation and justification of learning and teaching methods is important for students’ learning experience and success. For instance, it can be difficult to foster and test interpretation and conceptual understanding with a varied and largely unknown audience using multiple choice questions. The quizzes and tests on this MOOC attempted to do this by asking students to check the single wrong answer to questions that required them to think deeply about complex statistical data and/or interpret visual representations of data that had undergone statistical processes. This resulted in some confusion which largely disappeared when the rationale for this method was explained in the second offering of the MOOC.
2. Video is an integral part of many MOOCs. Producing broadcast-quality video and animations that demonstrate processes and explain concepts can quickly become all-consuming for the academic, who has to learn how to teach to camera with integrity. However, the requirement of an explicit script proved a powerful way to reflect the conceptualisation of the course (i.e. how to sequence topics in-depth), and the teachers’ explanations to the team about their design ideas helped them to reflect on their teaching approach.
3. Designing the D2I MOOC on the FutureLearn platform influenced the educators’ consideration of how they structured their teaching and educational resources. The professional development involved in designing and teaching the MOOC can feed back into face-to-face teaching. For example, for the educators, distilling the essence of a 50-minute face-to-face lecture into a series of five-minute MOOC videos interspersed with exercises (‘chunking learning’ as described above), was valuable for re-thinking the structure and links between face-to-face lectures and assignments (Czerniewicz, Glover, Deacon, & Walji, 2016).
Furthermore, we believe that our experience exemplifies each of the main conclusions of the University of Edinburgh report on MOOC pedagogy in the UK context (Bayne & Ross, 2014), in that MOOC pedagogy occurs at the level of individual course design and it is not embedded in the platform. Teacher preferences and beliefs, disciplinary influences, and other contextual factors are as paramount as in any learning design project, irrespective of the particular learning technology. The learning design of the D2I MOOC reflects one negotiated pedagogy that emerged in the pressured development process. The role of the teacher was central. Indeed, the effects of that teaching were so pivotal that there is not space within this paper to address them adequately. Instead they will be addressed in a separate paper on the implications of the design of this MOOC for Teaching Presence and Teaching Voice.
The potent mix of mature, motivated, strategic learners, learning from and with committed educators who are teaching in a high stakes, high profile, professional environment, using a rich digital medium with sophisticated capabilities and global reach to a massive, global audience, rendered a powerful learning outcome. As one of the MOOC facilitators who was also involved in the design of the course reflected on her experience:
It is often through passing on knowledge that we really understand it for ourselves… I still have so much to say about the MOOC and all that it could do. A truly enriching learning experience for all of us but a lot of hard work and not for the faint hearted.
Claire Donald is a lecturer and learning designer with the eLearning Group in the Centre for Learning and Research in Higher Education at the University of Auckland. Her research interests are in science and engineering education, learning design, teacher beliefs and learning analytics.
Elizabeth Ramsay is a learning designer with the eLearning Group in the Centre for Learning and Research in Higher Education at the University of Auckland. She is also the editor of the Centre’s biannual magazine Academix.
Inken Joerg is a graduate of the University of Education Heidelberg and at the time of writing, an intern and research assistant with the eLearning Group in the Centre for Learning and Research in Higher Education at the University of Auckland.