Peter Reed, University of Liverpool Dr Simon Watmough, University of Liverpool Paul Duvall, University of Liverpool
In recent times, there has been an increased interest around assessment feedback – evaluation of the University of Liverpool (UoL) Medical Curriculum has shown students have real concerns about the feedback they receive (Reed & Watmough, 2015; Watmough & O’Sullivan, 2011). These concerns have been amplified in recent years by results from the National Student Survey (NSS). The survey gives students who graduate from UK Universities the opportunity to complete an anonymous questionnaire in their final year just prior to graduation (NSS, 2014). One of the sections of the questionnaire refers to assessment and feedback, and responses from students from the School of Medicine have placed UoL amongst the lowest in the country (University guide 2015. Other evaluations of the Liverpool medical curriculum have shown students have concerns about feedback, with one of the main problems being about inconsistent or lack of feedback on Special Study Modules (Watmough & O’Sullivan, 2011).
This provides an obvious concern, as the general educational literature advocates many advantages of feedback for students, which relies on timeliness, encouraging reflection, is not too negative and offers students the chance to give their verdict (Rae & Cochrane, 2008). Feedback can be an essential component in the learning cycle (Leckey & Neill, 2001), and good feedback can enhance student satisfaction with their course, helps clarify what good performance is, delivers high quality information to students about their learning, encourages teacher and peer dialogue around learning, encourages positive motivational beliefs and self esteem and gives information to teachers than can be used to help shape the teaching (Nicol & Macfarlane-Dick, 2006).
In the 2006 NSS survey, despite a positive overall score for the UK’s higher education, the category of ‘assessment and feedback’ was “not considered up to scratch” (Times Higher Education, 2006). In 2007, The Guardian reported that “Universities received the lowest score in the area of assessment and feedback, where 62% of students were satisfied” (Lipsett, 2007). This is not just a UK phenomenon, as concerns about assessment and feedback have also been seen in the Australasia (Coates, 2009) and Republic of Ireland (ISSE, 2013) equivalents of the national student survey.
Somewhat as a response to the growing emphasis on assessment and feedback, the electronic management of assessment (EMA) is becoming a mainstream activity across higher education (HE). The common Virtual Learning Environments (VLEs) such as Blackboard Learn and Moodle provide an online space to support all aspects of learning, teaching and assessment, including the tools required to enable the online submission of coursework. Some third-party plugins/building blocks for the VLE also enable online marking within the software itself, e.g. the ability to provide comments and an overall grade. Turnitin is one popular third party tool which can be used via its website (submit.ac.uk) or via the custom integration for the VLE, and whilst literature searches related to Turnitin largely focus on its role in plagiarism detection, it also supports the workflows of submission of assignments. Through its ‘Grademark’ features, it also supports online marking and the provision of feedback to students.
With many online systems, including those for the submission, marking and feedback of written assignments, data are automatically created and logged by the system. Often this can be interrogated to identify patterns and correlations, which can then be used to inform practice. This is of particular interest for a number of reasons:
The following literature review investigates: the suitability of Turnitin and Grademark for EMA; and the role of learning analytics and assessment analytics in informing future practice related to assessment and feedback.
Collection and analysis of data related to learning, teaching and assessment can be used to identify areas of good practice as well as areas of concern, and given the emphasis of evidence-based practice in medical education, it is only fitting that we practise what we preach in the management, organisation and delivery of medical education itself. Through critiquing the data available, this level of ‘analytics’ is one affordance of the zeitgeist that is ‘big data’ (Ellaway, Pusic, Galbraith, & Cameron, 2014), presenting the opportunity to use data to analyse learning and teaching and shape future practice. Typically, the analysis of big data involves multiple data sets, but in HE most cases appear to be based on the data already captured from institutional systems (Ellaway et al., 2014) and can be used to answer specific questions, such as ‘what happened’, ‘what is happening’ and ‘where are trends leading’ (Cooper, 2012). Within education, this type of activity is often termed ‘academic analytics’ or ‘learning analytics’, which refers to the “interpretation of a wide range of data produced by and gathered on behalf of students in order to assess academic progress, predict future performance, and spot potential issues” (Johnson, Smith, Willis, Levine, & Haywood, 2011, p. 28).
In the context of this study, analysing data around the student and staff performance of summative assessment might be termed ‘assessment analytics’ – an area seldom considered in literature (Ellis, 2013). As Ellis suggests, assessment analytics might refer to a range of granular levels, from high-level degree classifications or grade point averages (GPAs) through to module results, individual assessment results and to specific strengths and weaknesses within an individual student’s work. The aim of collecting and analysing such data is in the identification of “actionable insights” (Cooper, 2012) or in other words, using data to identify aspects that could be acted upon or improved.
Jordan demonstrates both a fine granular level in analysing student performance on specific questions, through to a larger picture by correlating performance across two modules to ‘learn about learning’ (Jordan, 2013). However, the affordances of such analytics typically require assignments to be conducted/submitted online, a practice Heinrich, Milne, Ramsay and Morrison (2009) suggest is not used to its potential in HE. Ellis goes on to suggest: “Assessment analytics offers the potential for student attainment to be measured across time, in comparison with individual students’ starting points (ipsative development), with their peers and/or against benchmarks or standards” (Ellis, 2013).
At the University under study, Turnitin and Grademark have been introduced for the electronic management of assessments in various aspects of the MBCHB curriculum (Undergraduate Medicine). Using these systems, it is possible to harvest data on:
As a system for EMA, Turnitin and Grademark have received a wealth of reviews, with many authors citing positive and negative aspects (Buckley & Cowap, 2013; Heinrich et al., 2009; Johnson, Nádas, & Bell, 2010; Rolfe, 2011).
Buckley and Cowap’s (2013) qualitative study into the use of Turnitin for electronic submission and marking in one UK University identified both positive and negative aspects of the tool. Following specific staff training in the use of the tools within Turnitin and Grademark, 11 academic staff participated in focus groups to explore the staff experience. Many participants in their study identified benefits of Quickmark comments (saved comments that can be easily reused across papers by dragging and dropping onto areas of the paper), including the greater ease and speed of the tools, including “Grademark being quicker than marking by hand” (Buckley & Cowap, 2013, p. 569). These advantages are reinforced by Heinrich et al. (2009), who also identify other benefits such as anonymised marking and increased legibility of electronic feedback compared with handwritten feedback (Heinrich et al., 2009). Negative comments related to room for improvement in the ‘Assignments by Groups’ feature, such as indication of papers already marked, grade given, space for second marking and word count.
Johnson, Nadas and Bell (2010) explored the reliability of marking essays on screen, based on the “supposed cognitive and ergonomic challenges” of this mode. Despite suggestions marking on screen might have different results to marking on paper, their statistical analysis suggests no systematic influence on marker reliability as well as no difference within markers’ performance. This could provide an additional positive aspect to institutions dealing with large cohorts of students utilising large assessment teams, such as the school in the present study. The authors suggest: “For assessment agencies that are responsible for administering and coordinating large groups of markers, this is perhaps a positive finding because within-marker variation is more difficult to deal with than between-marker variation” (Johnson et al., 2010, p. 825).
Rolfe (2011) introduced the use of Turnitin as an instant formative feedback tool for two cohorts of bioscience students, citing positive experiences and perceptions of both academic staff and students (Rolfe, 2012). Also, Jonsson (2014) emphasises the importance of transparency in assessment and feedback and investigates the impact of using rubrics in the provision of feedback across three courses. Rubrics – a marking grid which identifies aspects of work that are to be marked as well as the amount of marks dedicated to each – are supported by Turnitin/Grademark. Jonsson suggests such attempts to increase transparency “are almost universally appreciated by students” (Jonsson, 2014, p. 3).
It is anticipated that many of these positive aspects will go some way to impacting on student satisfaction with assessment and feedback, noticeable in the National Student Survey and integral to the digital experience of students in higher education (Reed & Watmough, 2015).
The literature search was unable to identify any published research on the use of Turnitin/Grademark to analyse student or staff performance on written work.
In the UK, medical education is regulated by the General Medical Council (GMC). Since 1993, student-selected components (SSCs) have been recommended by the GMC to encourage students to explore areas that interest them outside of the “core curriculum”. In 1993, the GMC (GMC 1993) suggested that the majority of SSCs offered by medical schools should be based on subjects directly related to medicine, for example laboratory based or clinical, biological or behavioural, research orientated or descriptive. They also reflected trends in the medical education community worldwide (Riley, 2009; World Federation for Medical Education, 2003). However, the GMC did not stipulate that they should be exclusively restricted to these areas and SSCs can also include, for instance, maths, physics, social sciences, philosophy or even languages, literature or history of medicine. One thing that is common to the vast majority of SSCs is the skills for accessing and critically assessing research. A study has concluded that greater student input into SSCs can have a positive impact, notably in assisting students’ self-directed learning skills (Murphy et al., 2009).
While SSCs at different medical schools vary slightly in the way they are organised and assessed, there are purposes common to all SSC programmes. At Liverpool, SSCs are termed Special Study Modules (SSMs), although they have been renamed with the introduction of a new medical curriculum. At the time of this study, students undertook four SSMs in the first three years of their five-year programme, each SSM culminating in a final project, typically a written piece which aligns to the following aims:
Demonstrate the attainment of knowledge and skills to allow access onto certain intercalated degree programmes.
This study used a mixed methods approach to investigate the use of Turnitin and Grademark for EMA. The common limitation of a case study is the issue of generalization (Jensen & Rodgers, 2001; Silverman, 2013), although Flyvbjerg does challenge this notion: “it depends on the case one is speaking of and how it is chosen…. The strategic choice of case may greatly add to the generalisability of a case study” (Flyvbjerg, 2006). Thus, whilst this paper is cognisant that the data obtained relate to a single discipline in a single institution, it might be possible that the findings are applicable to other disciplines in different institutions. Notably, this study is based on large cohorts of students whereby multiple academic staff are involved in the assessment. Furthermore, the specific use of technology for assessment analytics offers both a conceptual and practical implementation of technology to analyse past, and inform future, practice.
This case identifies a sample of students (n=36) and SSM academic markers (referred to as convenors here on) (n=6) at the University of Liverpool. The volunteer convenors came from a pool of academics present at the SSM moderating board. This is where experienced convenors review SSMs to try and ensure consistency in marking by all convenors. Here, the pilot project was discussed and approved, with 6 academics requesting further information about what would be involved in the project.
Quantitative ‘system’ data have been extracted for analysis, with follow-up via short email interviews with SSM convenors to gain qualitative insight.
Student work is marked against the following seven objectives:
1. Explain why the study was needed given the existing policy/theory or evidence base.
2. Explain what the study was expected to achieve.
3. Outline what was done.
4. Outline what was found.
5. Explain what that means.
6. Explain the relevance of the findings and indicate possible future applications.
7. Present the study in a well organised, formal way (including the logical flow of concepts, grammar, typography and referencing).
All seven objectives are marked by the convenor as Unsatisfactory (fail), Fair (pass), Good (merit) or Excellent (distinction).
Turnitin and Grademark tools were used to facilitate the submission, marking and feedback of work for the first SSM module – SSM1. For this, students were instructed to upload their work to the Turnitin assignment within the institution’s Blackboard VLE and append the name of their SSM module leader to the title of their submission.
Students’ submitted papers were marked using the ‘Rubric’ feature within Grademark as Unsatisfactory, Fair, Good or Excellent, across seven different objectives (identified above and included in Appendix 1). Data on the comments and marks assigned by convenors were exported from the system and manipulated in Microsoft Excel to anonymise student names and filter information to count totals, etc. The aim here was of analysing data to identify patterns in student or staff performance across the SSM. It was also recognised that this activity would be exploratory in nature as the exact details of available data, and the ease of manipulating those data, was unknown.
The qualitative grades above were converted to points/numbers to enable easier data manipulation (Table 1).
Table 1 Grades conversion to points for analysis
Following the collection of data from the system, a number of short interviews were conducted over email with the academic staff involved in the pilot. Meho (2006) highlights the benefits of conducting email interviews, citing reduced cost, reduced transcribing requirements, and participation across geographical boundaries as some of the key benefits. These were certainly applicable to the current study and helped overcome these key challenges. It is recognised, however, that the asynchronous nature of email interviews can cause delays in the interview process, as respondents may take days or even weeks to respond.
The aim of these interviews was to gain insight into the academic staff perspective on both the ease of use of the system for EMA and their views on the potential of assessment analytics. Of the six staff involved, responses were received from three. The extracted quantitative data were anonymised, represented graphically and sent to candidates to inform their ability to respond to the following six questions:
1. How did you find the process of accessing student papers and marking online?
2. Was the level of support you received sufficient or is more support needed to engage with the system further? If so, what support would you want?
3. Do you think the data available for analysis by the system are useful, and why? How might they inform future practice of the School?
4. Are there any issues with the system or with the data that you would like to raise, and what other information would you want to have/know?
5. What steps would make the online marking easier/better?
6. How does this online method compare to traditional methods of marking? Do you feel the system encourages/makes it easier to give relevant feedback to students?
An additional seventh question was asked of the academic with moderating responsibilities for the SSM:
7. How has this approach impacted on the moderation of SSM coursework?
Three responses to the email interview were received and iteratively read with the view of identifying themes. After identifying a theme, e.g. ‘comments related to ease of use of the system’, a colour was assigned to the theme (e.g. yellow) and the corresponding text was highlighted. New themes identified were assigned a new colour and appropriate comments highlighted. As there was a relatively small amount of data for analysis, this approach to coding made the identification of specific statements efficient and effective. It also enabled the authors to provide a concise summary to each question.
It is recognised, however, that more robust methods might be necessary for greater volumes of data.
As an evaluative piece of work, and in consideration that much of the data presented here already exist for analysis (Ellaway et al., 2014), ethical approval was not sought for this study. When using existing data, due consideration must be given to the purpose of the original collection of the data and any associated secondary use issues, prior to their utilisation as part of a new study (Ellaway et al., 2014). However, a number of steps have been taken to adhere to the British Educational Research Association’s ethical guidelines for educational research (BERA, 2011) to ensure a level of integrity and rigour. Meho’s (2006) work has also offered guidance for conducting ethical email interviews. These include:
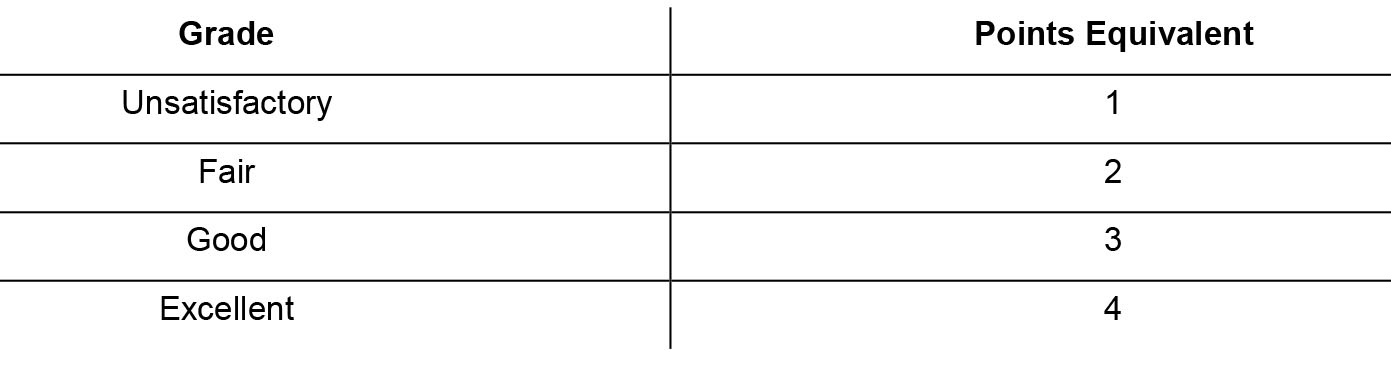
Data were collected for student assignments (n=36). Chart 1 demonstrates the frequency of marks awarded for Unsatisfactory, Fair, Good and Excellent grades across the sample.
A fairly normal distribution can be seen, with Fair (n=92) and Good (n=102) grades most commonly applied.
Chart 1 Overall frequency of marks awarded
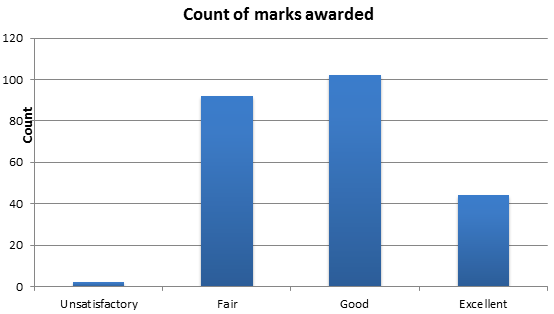
Chart 2 demonstrates the frequency of grades broken down by Objective. Only two Unsatisfactory grades were applied – one each to Objectives 3 and 7. Objective 4 received the most Good grades (n=20) but also the fewest Excellent grades (n=3).
Chart 2 Frequency of Grades Awarded by Objective
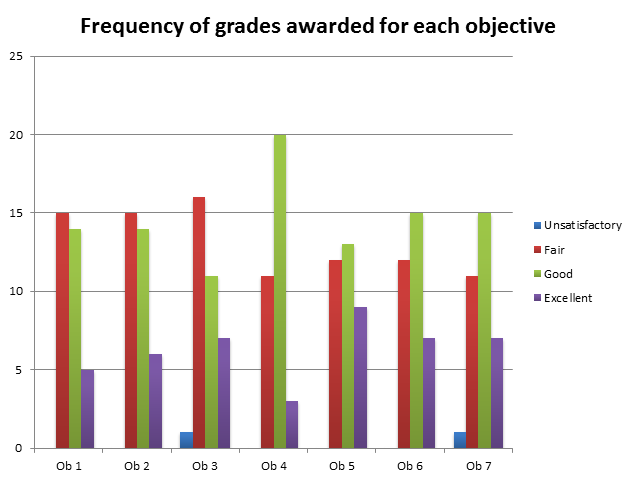
Chart 3 takes a more granular look at the number of individual Quickmark Comments that were made on student papers in relation to each of the objectives. The data demonstrate an increase in comments related to the later objectives.
Chart 3 Number of QM Comments by Objective
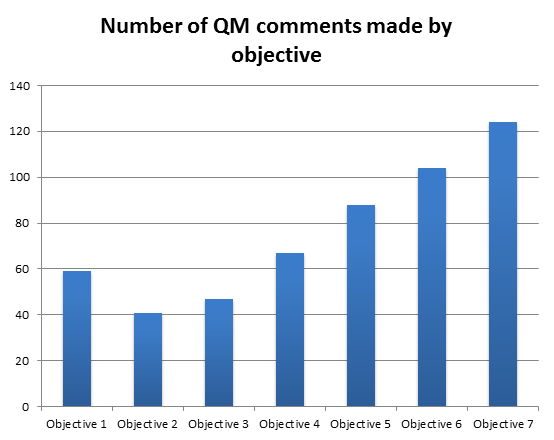
Chart 4 demonstrates the mean number of points awarded by each marker (as in Table 1). The data suggest a reasonably even distribution across markers; however, Marker 4 and Marker 6 only marked one paper each, therefore a true mean is unable to be determined for these individuals.
N.B.: The total amount of points possible is 28 (a score of 4 [Excellent] for all seven objectives).
Chart 4 Mean number of points awarded by each marker
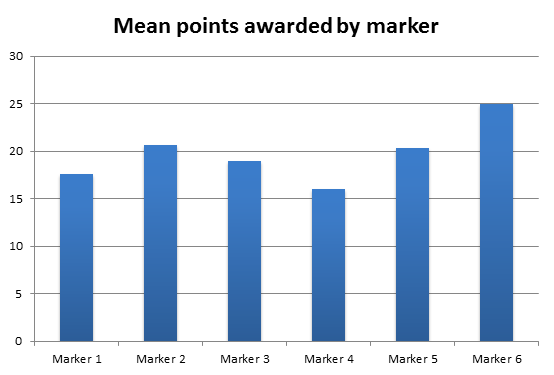
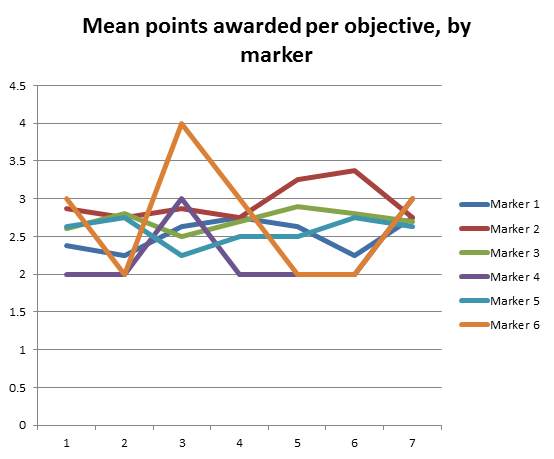
Chart 5 demonstrates the mean points awarded by marker for each objective. The data identify reasonable consistency in the points awarded across objectives, with the exception of Marker 6, whose mean increased sharply for Objective 3, and Marker 2, whose mean increased slightly for Objectives 5 and 6.
Chart 5 Mean points awarded per objective, by marker
For this relatively small study, summarising responses to each of the questions seemed a logical way to present qualitative data. In addition, coding of qualitative comments identifies themes that emerged from responses.
Q1. How did you find the process of accessing student papers and marking online?
Responses were generally positive to this first question. Comments suggested the system was “relatively straightforward” to use and “get the hang of”. One respondent emphasised the ease of marking in comparison with the “old way of working”. However, one comment suggested some confusion between the “marking sheet” (rubric) with in-text and general comments.
Q2. Was the level of support you received sufficient or is more support needed to engage with the system further? If so what support would you want?
Generally in this case, the provision of technical support was good. Respondents did not have any particular difficulties in using the system other than the slight confusion identified earlier. One respondent suggests the support was very good from the “Learning Technology Lecturer”, showing them how to use the tools available. Another respondent unfortunately could not attend face-to-face training and suggested this would have been beneficial.
Q3. Do you think the data available for analysis by the system are useful, and why? How might they inform future practices of the School?
A number of interesting comments were received to this question. One comment suggested the data were useful to reassure students and externals that we are monitoring for consistency, and the respondent with moderating responsibilities suggested the data available could “identify convenors who mark outside normal parameters and identify who is giving feedback to the students and who isn't”.
One respondent raised interesting dilemmas:
I’m not quite sure what I think about this. Obviously we’re all interested in what our own performance is (although I’m not sure we should be told!). Major inconsistencies between markers or between objectives would be worrying, but I don’t think we have a solid basis for expecting any particular result – to put it crudely, would ‘all excellent’ be a good thing (great students and course-management) or bad (slack marking)?
Q4. Are there any issues with the system or with the data that you would like to raise, and what other information would you want to have/know?
The only point raised here related to the confusion identified in Q1, relating to “different categories of notes/comments boxes”.
Q5. What steps would make the online marking easier/better?
Again only one suggestion was made in response to this question, regarding support guides. N.B.: This was from the same respondent who identified confusion with notes/comments in Q4.
Q6. How does this online method compare to traditional methods of marking? Do you feel the system encourages/makes it easier to give relevant feedback to students?
Whilst one respondent suggested it could take longer as it is not as simple to “skim and skip” through papers, all respondents were in favour of this implementation. Comments suggest the system encourages markers to leave feedback and can “raise standards of marking” through “better feedback”. For one respondent, the use of in-text comments was a key indicator of relevance and quality: “I can leave comments about the introduction at the end of the introduction and can leave feedback about the methods next to the methods section and so on.” (Comment from anonymous moderator)
Q7. How has this approach impacted on the moderation of SSM coursework?
This question was only sent to the one person with moderating responsibilities for the SSMs in this pilot. The moderator suggested the moderating process is now “easier”, and that it had been “simplified beyond recognition”. The ability to see which marks have been awarded and where is significant for moderation and can make the moderation process easier: “I can follow the way the convenor has graded each objective and any feedback in the relevant place which makes it easier for me as a moderator to check the standards of the SSM as I can follow where the convenor has marked and made comments.”
The data obtained from the system have provided insight into the staff and student performances in this assessment.
Chart 1 demonstrates the frequency of marks awarded for Unsatisfactory, Fair, Good and Excellent grades. This level of granularity provides an overall view on the marks awarded across the student cohort and suggests Fair and Good were significantly the most common marks left across all assignments – more than double the amount of Fair (n=92) and Good (n=102) grades were assigned compared to Excellent (n=44). The ability to easily visualise this information can be particularly useful for larger cohorts when multiple markers are involved.
Chart 2 demonstrates the frequency of grades awarded for each objective across the student cohort. The distribution of grades across the objectives appears normal. Anomalies would typically be seen by significantly more grades at the extremes, e.g. lots of Unsatisfactory or Excellent grades. This might indicate an objective was too easy/difficult and could inform future practice.
The awarding of Fair and Good grades was reasonably similar for each objective, with the exception of Objective 4, which received almost double the amount of Good (n=20) grades than Fair (n=11). In considering why this was the case, the data might suggest students are missing a key aspect in their writing that would justify an Excellent grade, and therefore staff could emphasise this aspect in feedback to students as well as in the teaching of future cohorts. Interestingly, it could also give rise to investigation as to the standards upheld in the marking by academic staff, e.g. are staff too strict in the awarding of excellent grades? On this occasion, however, the use of rubrics demonstrates transparency in the marking process to justify marks awarded.
Chart 3 takes a more granular look at the number of individual Quickmark Comments that were made on student papers in relation to each of the objectives. It is evident that markers left more comments related to the latter objectives, perhaps as these related to the more critical aspects of the paper and warranted additional scrutiny, or even because students were potentially underperforming in this area. For example, Objective 7 received a total of 124 comments, compared to Objective 2, which received just 41. Whilst this in itself does not demonstrate a complete picture of the associated complexities, it does visualise a pattern and provoke further investigation.
In considering Charts 2 and 3 collectively, there doesn’t appear to be any correlation between the number of comments left per objective and the distribution of grades per objective. In theory, this visualisation could be used to draw correlations between overall marks and specific aspects of performance, e.g. do students who suffer in referencing consistently score lower overall marks?
Chart 4 demonstrates the mean number of points awarded by each marker. Again, anomalous data here would identify extremes, e.g. significantly low or significantly high mean points, but the data suggest a reasonably even distribution across markers. As identified earlier, Marker 4 and Marker 6 only marked one paper each. Interestingly, these two markers represent the lowest and highest mean scores respectively (16 and 25). This could be identified as anomalous and ignored for further discussion. The mean scores between Marker 1 (17.6), Marker 2 (20.6), Marker 3 (19) and Marker 5 (20.4) demonstrate a range of less than 3 points (20.4 – 17.6 = 2.8), suggesting marking is consistent across this group of markers. A simple visualisation of these data adds strength to the quality assurance processes for consistent marking.
Chart 5 demonstrates the mean points awarded by marker for each objective. We can assume from previous charts that there is no correlation between the number of quickmarks left with the distribution of grades across the group of markers; however, this chart demonstrates differences between the grades assigned to the latter objectives by Marker 2 in comparison with Marker 1 and Marker 6. Marker 2 demonstrated a reasonably sharp increase in the points awarded for Objectives 5 and 6, and dipped for Objective 7. Marker 1 and Marker 6 demonstrated the opposite – decreasing points for Objectives 5 and 6 and increasing for Objective 7. Again, this in itself does not tell a complete picture; however, being able to identify such patterns for further enquiry can raise standards of quality assurance. The other markers in the pilot were reasonably consistent across all objectives.
Whilst the numbers themselves do not identify why this has been observed, it could be suggested that individual markers may approach the more critical objectives differently. However, this is speculation at this point, and further investigation would be required to learn more.
Although only three responses were received to the email interview, the qualitative data obtained provide useful feedback to serve as a mini evaluation of the piloted systems for EMA and the role of assessment analytics.
Comments were positive in relation to Turnitin and Grademark system as well as the potential for data collection for assessment analytics.
In general, respondents were satisfied with the ease-of-use of the system. With little training, academic staff were able to use the tools to leave feedback and apply grades through rubrics. The points raised by one respondent, however, serve as a useful reminder that staff development around such tools is an integral requirement for successful implementation, along with ongoing support to overcome challenges and difficulties. For some, these new ways of working can be more effective and less time consuming; however, this should not be an assumption made for all staff.
The use of system data to analyse staff and student performance has raised some interesting points, with one significant quote, embedded earlier:
I’m not quite sure what I think about this. Obviously we’re all interested in what our own performance is (although I’m not sure we should be told!). Major inconsistencies between markers or between objectives would be worrying, but I don’t think we have a solid basis for expecting any particular result – to put it crudely, would ‘all excellent’ be a good thing (great students and course-management) or bad (slack marking)? (Anonymous respondent).
Why this respondent is unsure as to whether markers should be informed about performance data needs further investigation. This could suggest a belief that this is ‘management data’ and not something for markers to worry about. The second point made in this comment reinforces the view that we cannot read too much into the quantitative data obtained in analytics – ‘all Excellent’ could be viewed as a positive or negative aspect and needs further enquiry. However, it does inform us of patterns and trends across a cohort which may not have been identified otherwise. This could be because of “great students and course-management” or “slack marking”, but it might also identify aspects of the course that students might be struggling with generally, e.g. referencing. Either way, the availability of such data can be used to inform future practice, whether that be through more attention to specific issues such as referencing, or greater attention to higher level aspects of quality, e.g. slack marking or the course being too easy. As one other comment suggested, such data can improve quality and be reassuring to staff and students that monitoring for consistency is a priority.
One immediate observation in collecting and analysing the data above is the potential rise of the Heisenberg Uncertainty Principle or a digital Hawthorne effect (Ellaway et al., 2014), whereby the people whom data are being collected on act differently because they are aware of such data collection. This could have an impact on the reliability of the data. For example, academic staff marking work may be aware of their position as outliers (very strict or alternatively very lean in the awarding of marks) and thus change their typical view due to the awareness of being ‘tracked’ and analysed. Whilst one comment suggested “no Hawthorne effect from me” (Anonymous respondent), this is just one comment from an individual, and thus not generalisable. Also, the respondent was unable to demonstrate a Hawthorne effect as there was no suggestion the data were being, or even could possibly be, observed. Therefore, an inclination to mark differently based on perception of what would be in keeping with other markers is still a potential problem. Further research would be required to analyse this aspect across larger groups of staff.
The data presented in this paper afford us an interesting insight into two aspects related to assessment: a small-scale evaluation of Turnitin and Grademark for EMA; and analysis of data for student and academic staff performance in assessment. As a pilot, this project has conceptualised the role of Turnitin and Grademark for use in assessment analytics. As such, the methodology and findings presented will be of interest to departments/faculties in the use of a system for the electronic management of assessment, as well as academic staff and managers involved in assessing students’ written work. The obvious limitation of this study lies in the small number of interviewees to provide qualitative feedback. This is not seen as a significant problem, however, as the quantitative data provided for assessment analytics reinforce the potential and relevance of such an approach. Furthermore, other published work with greater sample sizes already exists in relation to the pros and cons of using Turnitin for EMA (Buckley & Cowap, 2013; Heinrich et al., 2009; Johnson et al., 2010; Rolfe, 2011). Furthermore, due to the limited published research and case studies on the topics covered, this case study will be of interest to all disciplines and institutions beyond those included here.
Specifically for the written assignment detailed in this paper, the data available from within the system can be manipulated to visualise performance across different objectives; identify areas of clear strengths/weaknesses; and analyse consistency of markers. Should an assignment be marked quantitatively, these data could also relate performance in specific objectives to overall grade awarded, and, furthermore, analysis could be made against specific Quickmarks applied, e.g. referencing, grammar, punctuation or any other Quickmark. Closer scrutiny of the data could investigate correlations between students who struggle with a particular objective and their overall grade, e.g. do students who score low on referencing tend to receive lower marks overall? Again, this scenario is purely hypothetical but identifies the potential of such assessment analytics.
The quantitative data obtained in this study only provide a snapshot view of student performance and staff marks awarded. They tell us that Excellent marks were not awarded as much as Fair or Good marks, but they do not tell us why. For example, are students not supported or developed enough to provide that extra level to achieve Excellent in their written work, e.g. not reflecting critically enough, or do markers apply stringent measures in awarding such marks? Is there consistency in understanding what ‘excellent’ means amongst convenors, or in attitudes towards allocating such marks? Further qualitative investigation would be required to tease out reasoning etc., but this could suggest assessment analytics, whilst providing a rich data set and unique insight, is not a panacea for analysing performance on assessments. Furthermore, as staff become aware of such analytics, their performance in marking could demonstrate a digital Hawthorne effect, whereby they adapt their marking habits as a result of their awareness of being observed. Whilst there is no evidence for this phenomenon in this small study, it is clearly a potential issue and future studies should be cognisant.
One other point for future studies to be mindful of would be specific consideration in the development of rubrics and Quickmarks to support any analysis that might take place. Well-defined Quickmarks would be recommended to ensure there is no blurring of boundaries when analysing the use of those Quickmarks in comparison with others. Instead of a linear process of marking single scripts, the proposed solution in this paper provides a more holistic picture of marking and student/staff performance, enabling easy identification of various aspects such as areas of concern in student papers, e.g. consistent good/bad performance across a cohort, and staff performance, e.g. inconsistent marking or ‘hawks’ and ‘doves’.
Further to this pilot, Turnitin and Grademark have been implemented across the School of Medicine for EMA within the Research and Scholarship strand of the new curriculum 2014. This is very similar to the SSMs detailed in the present study and maintains the same aims and outcomes. The implication here is that all work will be submitted online through Turnitin and all convenors will use the Grademark tools in the marking of work. The processes identified in this paper could prove invaluable in assuring quality across such a large group of conveners.
Finally, many questions remain in relation to assessment analytics. Where does this level of analytics stop? Does it lead to predicting the future performance and then intervening to shape a pathway? Is that then considered as innovation in personalised learning or does it focus on removing failing students early because they are not on the road to a good qualification? How do institutions gain access to these data, e.g. do they have to pay the hosting provider, and who actually owns them? Experiences from this study would suggest that whilst the data are available in the system, they are not particularly easy to access, and some skills in manipulating the data are required to make real sense of them. This potentially leaves scope for vendors, e.g. Turnitin, to provide a ‘dashboard’ view of the data to increase accessibility.
As learning analytics continues to develop and enter mainstream activities in higher education, increasing attention to the ethical implications will be drawn. Large organisations such as universities have always had access to system data, but they have perhaps not been efficient is using these data in any meaningful way. This does not mean it can, or should, use these data without the voluntary consent of whom the data concern, and how might a student give consent when there is a requirement on their part to submit assessed work through a particular system? Do they have a choice, and what are the implications of them refusing to submit work online? Thus, the future of analytics is likely to walk a tightrope between its potential to serve learning and the ethical challenges of doing so.
As Slade and Prinsloo suggest, “the management of students’ understanding and perceptions is therefore a major priority for any institution that seeks to embed learning analytics into its standard operations” (Slade & Prinsloo, 2013).
Peter Reed is a Lecturer in Technology Enhanced Learning at the University of Liverpool. His role takes a high level view of TEL across the Faculty and University as well as leading on TEL initiatives within Continuing Professional Development (CPD) and postgraduate programmes.
Simon Watmough has a PhD in medical education and works as an educational researcher in the University of Liverpool with a focus on curriculum evaluation. He also teaches on the research and scholarship strand of the undergraduate medical curriculum and supervises PhD students.
Paul Duvall works as the Director of Technology Enhanced Learning within the medical school at the University of Liverpool. He has extensive experience working in the higher education sector in a variety of roles, specialising in the use of learning technology. His current academic position provides the lead for the innovative and effective use of technology within the medical curriculum.